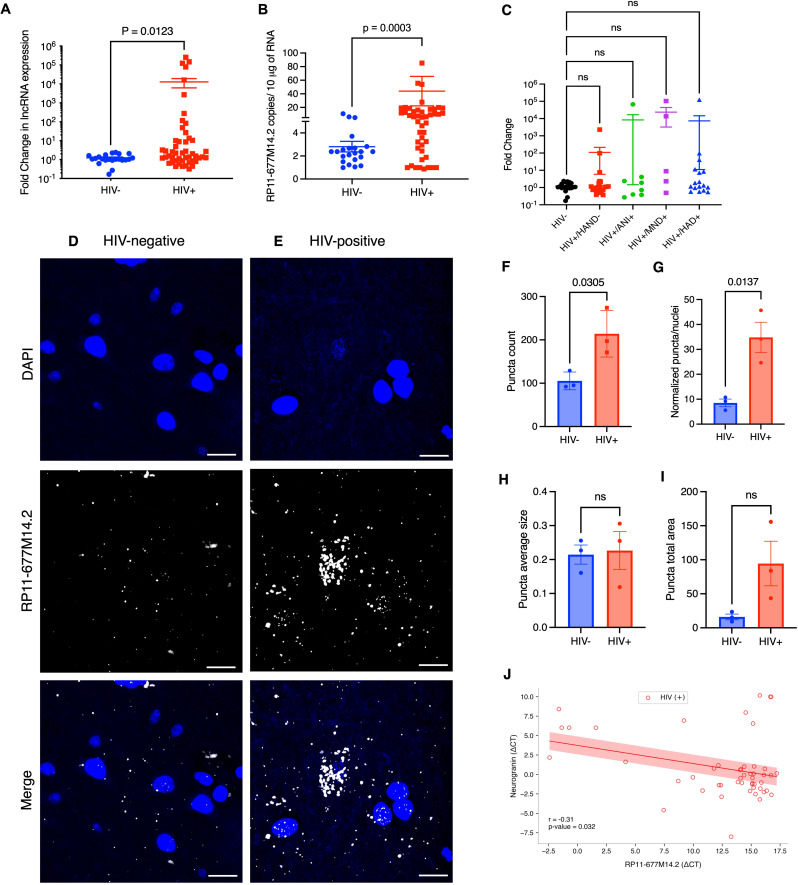
Fig. 2.
Expression analysis of RP11-677M14.2 transcript in frontal cortex tissues. (A) Relative expression of RP11-677M14.2 in FC from people with HIV-1 (N = 49) compared with control individuals without HIV-1 (N = 22) by RT-qPCR. (B) Quantification of RP11-677M14.2 transcript copy number in FC samples of HIV-1 positive individuals compared to control individuals. (C) Comparison of RP11-677M14.2 expression across different clinical stages of HAND. (D-E) Representative images of single molecule RNA HCR FISH with probe sets for RP11-677M14.2 transcript (AF-647, white puncta) in FC samples from people with and without HIV-1 (N = 3 per group). DAPI stain for cell nuclei is shown in blue. Scale bars show 10 μm. The images are z-projections of image stacks acquired at ×60 magnification. Quantification of the fluorescence signal from the experiment in panels D-E. For each the HIV-negative and HIV-positive data set, we quantified (F) total puncta count per image, (G) total puncta count normalized per cell number, (H) puncta average size and (I) puncta fluorescence signal intensity from averaged 5 images per individual per condition. (J) Pearson’s correlation analysis (red line) between the normalized expression of Nrgn mRNA and the normalized expression of RP11-677M14.2 in 49 HIV + frontal cortex samples (red circles) assessed by RT-qPCR. The shaded red area represents the confidence interval (R=-0.31, P = 0.032)

