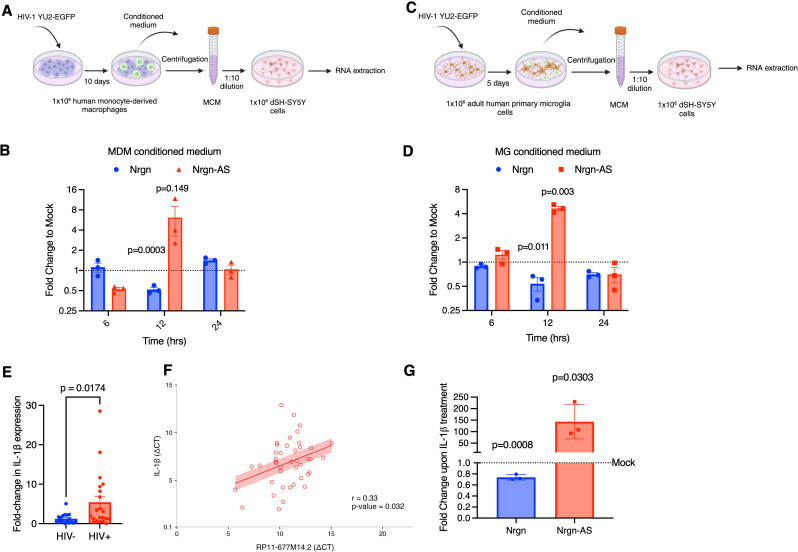
Fig. 5.
HIV-1 infection dysregulates Nrgn-lncRNA axis in vitro. (A-D) Schematic depicts experimental designed in which Nrgn-lncRNA expression axis was investigated: SH-SY5Y cells were differentiated with RA for 7 days and exposed to supernatant from HIV-1-infected or mock-infected (A-B) MDM or (C-D) Microglia. RNA was harvested at, 6, 12 and 24 h of incubation and both the RP11-677M14.2 transcript and Nrgn mRNA levels were assessed by RT-PCR. (E) Relative expression of IL-1β in FC brain samples from HIV-1 positive individuals (N = 21) compared to control individuals (N = 18) assessed by RT-qPCR. (F) Pearson’s correlation analysis (red line) between the normalized expression of IL-1β and the normalized expression of RP11-677M14.2 in 49 HIV + frontal cortex samples (red circles) assessed by RT-qPCR. The shaded red area represents the confidence interval (R = 0.33, P = 0.032) (G) SH-SY5Y cells were differentiated with RA for 7 days and exposed to 1 ng of recombinant IL-1β for 1 h and RNA was harvested. Nrgn and RP11-677M14.2 transcript expression levels were assessed and compared to mock-treated neurons through RT-qPCR. Dotted lines represent the mock-treated neurons expression, blue bars represent average Nrgn fold change in expression whereas red bars represent the average lncRNA fold change in expression

