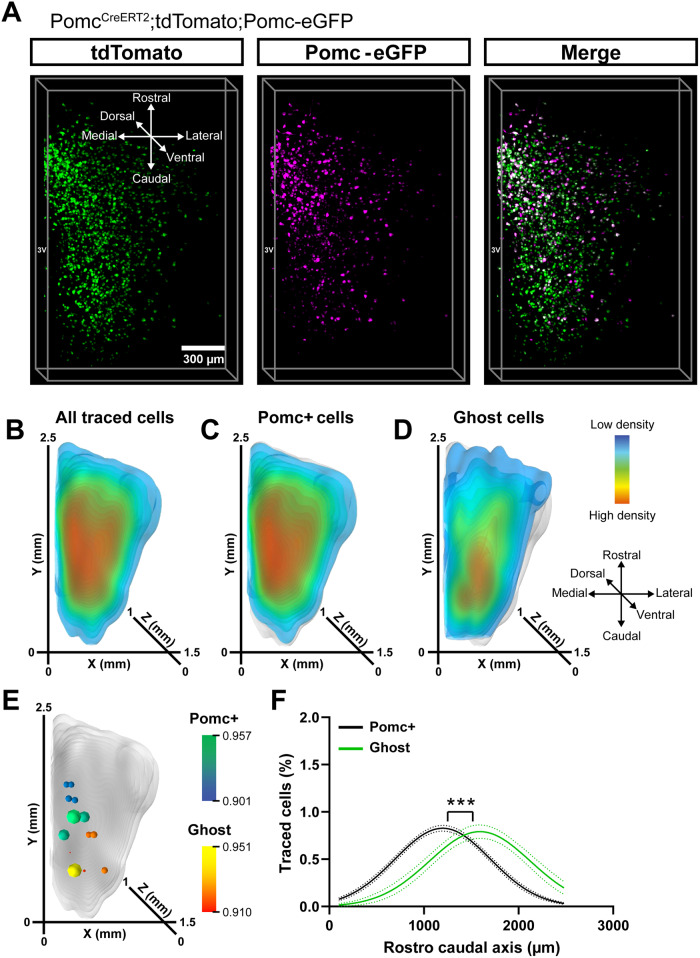
Fig. 2. Ghost neurons show a distinct spatial distribution under chow-diet.
A Representative 3D reconstruction of populations expressing tdTomato, Pomc-eGFP (hemi-arcuate nucleus), and the combined signal in PomcCreERT2;tdTomato;Pomc-eGFP male mice (n = 3) 2 weeks after adult onset (12-week-old mice) administration of tamoxifen. Isosurface density plots of the whole traced cell population (B), the Pomc+ subset (C) and Ghost neurons (D). Grey shaded areas in (D, E) represent the whole traced cell population. E Statistical representation of the differences in distribution between the Pomc+ cells and Ghost cells using a two-tailed t test. P values are plotted as spheres within the space occupied by the neurons (background). The size and colour of the spheres indicate the significance values in a range from green to blue (Pomc + ) and yellow to red (Ghost). F Cumulative distribution of the Pomc+ and Ghost subpopulations for the rostro-caudal spatial axis. Data are shown as non-linear fitted curves (Gaussian). ***P < 0.001 with extra-sum-of-squares F-test comparison. Data were obtained from 2 independent experiments. n indicates the individual biological values. Source data are provided as a Source Data file.

