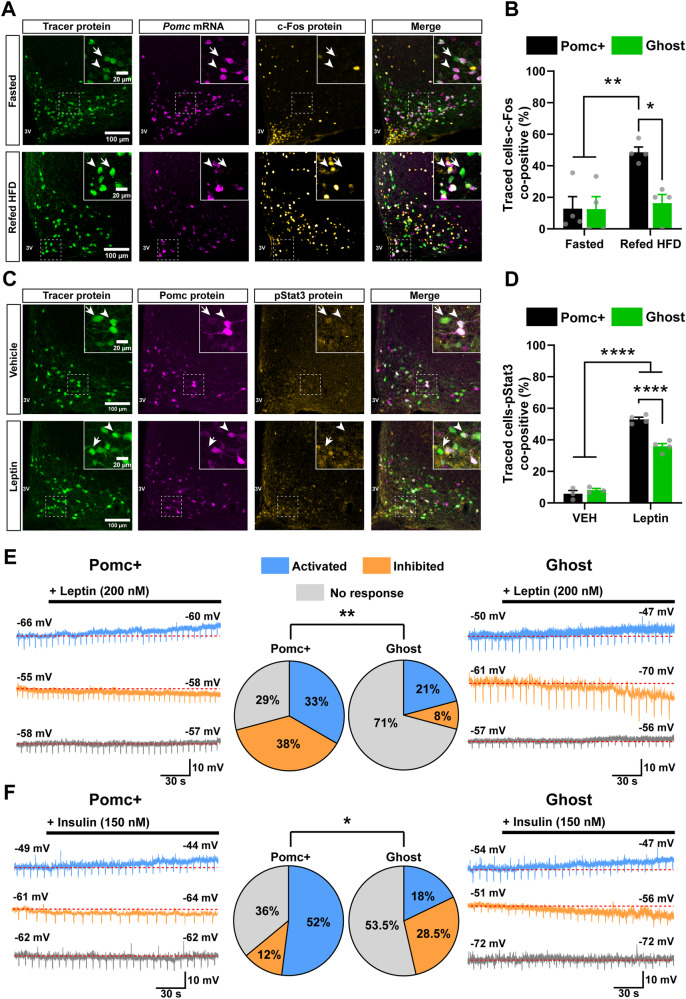
Fig. 3. Ghost cells have atypical sensitivity to nutritional and hormonal cues.
A Representative FISH/IHC images of the tdTomato reporter (protein), Pomc (mRNA) and c-FOS (protein) in PomcCreERT2;tdTomato male mice challenged with fasting (24 h, n = 4) or fasting followed by refeeding (2 h, n = 4). B Quantification of Pomc+ versus Ghost neurons positive for c-FOS relative to (A). C Representative IHC images of the tdTomato reporter, Pomc protein, and pStat3 in CD-fed PomcCreERT2;tdTomato male mice injected subcutaneously with vehicle (n = 3) or leptin (5 mg/kg; n = 4) 45 min before brain harvest. D Quantification of the percentage of reporter cells (tdTomato) positive for pStat3 in Pomc+ versus Ghost neurons relative to (C). E, F Ex-vivo whole cell patch-clamp recording of Ghost and Pomc+ neurons in PomcCreERT2;tdTomato;Pomc-eGFP male mice following leptin (200 nM) or insulin (150 nM) challenge. Representative traces of Pomc+ or Ghost neurons are shown on the left and right. Middle: % of activated cells (Δ resting membrane potential ≥+2 mV, Δ input resistance ≥10% change) in response to leptin (E, blue; Pomc + : n = 8; Ghost: n = 5) or insulin (F, blue; Pomc + : n = 13; Ghost: n = 5), inhibited cells (Δ resting membrane potential ≤−2 mV, Δ input resistance ≥10% change) in response to leptin (E, orange; Pomc + : n = 9; Ghost: n = 2) or insulin (F, orange; Pomc + : n = 3; Ghost: n = 8) and non-responsive cells (grey; Leptin: Pomc + : n = 7; Ghost: n = 17; insulin: Pomc + : n = 9; Ghost: n = 15). Downward deflections in current-clamp recordings represent the membrane voltage responses to constant hyperpolarizing currents. Dotted lines represent the resting membrane potential. 16 total mice for leptin and 17 for insulin were analyzed in this experiment. pStat3: phosphorylated transducer and activator of transcription-3, CD: chow diet, HFD: high fat diet. In (A, C) arrowheads define Pomc+ neurons, arrows define Ghost neurons. All mice were studied 2 weeks after adult onset (12-week-old mice) administration of tamoxifen. n indicates the individual biological values. Data are mean ± s.e.m from 2 independent experiments and were analyzed by 2-way ANOVA followed by Tukey’s post-test. In (B), **P = 0.0176 and *P = 0.091. In (D), ****P < 0,0001. Data in (E, F) were obtained from 3 independent experiments analyzed by chi-squared test. Source data are provided as a Source Data file.

