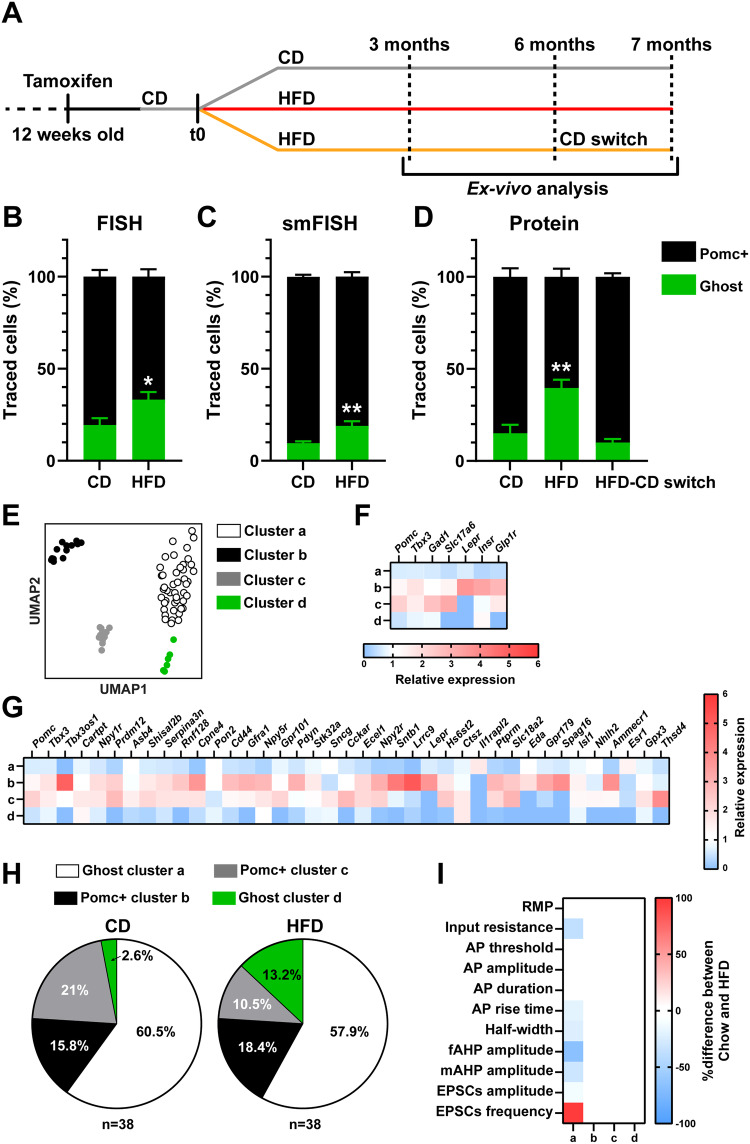
Fig. 4. Ghost cell recruitment in HFD-induced obesity.
A Reporter mice were treated with tamoxifen at 12 weeks of age and exposed to HFD, CD or (HFD-CD switch) for different durations 2 weeks later (t0). B, C Quantification of Pomc+ and Ghost neurons in PomcCreERT2;ZsGreen male mice fed with CD or HFD (6 months). Pomc mRNA was analyzed by FISH (B, n = 8 per group) or smFISH (C, n = 6 per group). D Quantification by IHC of Pomc+ and Ghost neurons in PomcCreERT2;ZsGreen male mice fed with CD (n = 4), HFD (7 months, n = 4), or exposed to HFD-CD switch (n = 3). E UMAP representation of 76 neurons analyzed by patch-seq in PomcCreERT2;tdTomato male mice exposed to CD (n = 5) or HFD (n = 5) for 6 months. We collected n = 38 cells from CD mice and n = 38 from HFD mice. We identified 4 main clusters: a (45 cells), b (13 cells), c (12 cells) and d (6 cells). F Heatmap of the relative gene expression (mean expression one cluster relative to the others) of Typical Pomc+ markers altered in Ghost neurons based on the data in Fig. 1D. G Heatmap of the relative gene expression (mean expression of one cluster relative to the others) of Pomc-neuron specific genes from HypoMAP in the clusters identified in (E). H Change in the % of cells in each cluster between the CD and HFD conditions. I Effects of HFD exposure (6 months) on electrophysiological parameters in the different clusters that were significantly different (HFD vs. CD) by two-tailed t test. RMP resting membrane potential. AP action potential. fAHP fast afterhyperpolarization. mAHP medium afterhyperpolarization. EPSCs: excitatory post synaptic currents. HFD high fat diet, CD chow diet. Data in (B−D) are mean ± s.e.m from 3 (B, C) or 2 (D) independent experiments. Data in (E) were obtained from 3 independent experiments. n indicates the individual biological values. In (B, C) *P = 0.0207 and **P = 0.0087 by two-tailed t test (CD Ghost vs HFD Ghost). In (D), **P = 0.0058 (CD Ghost vs HFD Ghost) and **P = 0.0022 (HFD Ghost vs HFD-CD Ghost) by ANOVA followed by Tukey’s post-test. Data in (H) are shown as a percentage of the total population P = 0,0004 by chi-squared test. Source data are in the Source Data file.

