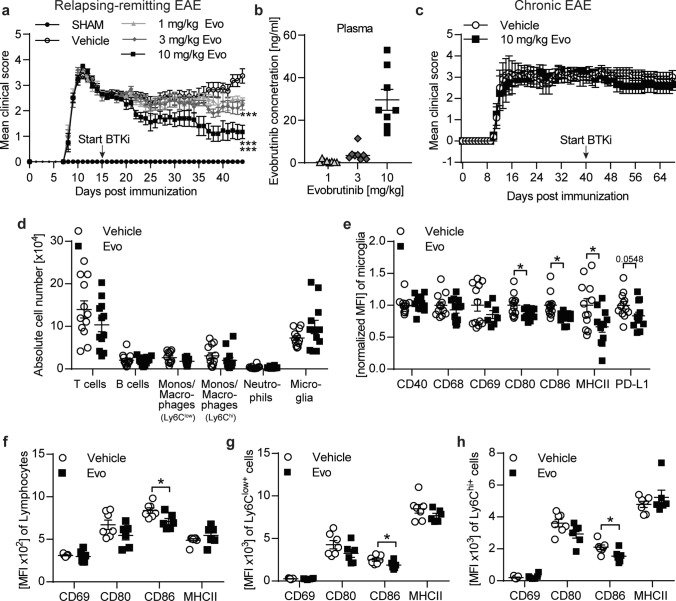
Fig. 2.
Therapeutic evobrutinib treatment ameliorate disease severity in active EAE and alter microglial phenotype in chronic EAE. a, b SJL/J mice were immunized with PLP139-151. Treatment with 1, 3 and 10 mg/kg evobrutinib or vehicle control were started at day 15 post immunization and continued daily. a Group EAE score (n = 10–15). b Blood was collected 2 h after treatment and evobrutinib concentration was measured in the plasma (n = 10–15). c–h C57BL/6 J mice were immunized with MOG peptide 35–55. Treatment with 10 mg/kg evobrutinib or vehicle control were started at the chronic phase of disease at day 40 and continued daily. c Group EAE score (n = 5–6). d Composition of brain-infiltrating and -resident cells (B cells: CD19+CD20+, T cells: CD3+, monos/macrophages: CD11b+CD45hiLy6Clow, monos/macrophages: CD11b+CD45hiLy6Chi, neutrophils: CD11b+CD45hiLy6C+Ly6G+, microglia: CD11b+CD45lowLy6C−Ly6G−) were analyzed by flow cytometry, (n = 11–12). e Microglia were isolated from the brain. Changes in the expression of disease-associated microglial markers were analysed by flow cytometry and are shown as mean fluorescence intensity, normalized to vehicle control (MFI, n = 11–12). f Lymphocytes, g Ly6Clow+ macrophages/monocytes and h Ly6Chi+ macrophages/monocytes were isolated from the brain and changes in expression of markers involved in activation and antigen presentation were analyzed by flow cytometry and are shown as mean fluorescence intensity (MFI, n = 11–12). The mean ± standard error of the mean is indicated in all graphs. a, c Statistical analyses for significant differences on clinical scores over time was performed using Friedman with Dunn’s post-hoc test. d–h Data sets are pooled or representative from at least two independent experiments. Asterisks indicate significant differences calculated using the unpaired two-tailed t-test (*P ≤ 0.05, **P ≤ 0.01, ***P ≤ 0.001)

