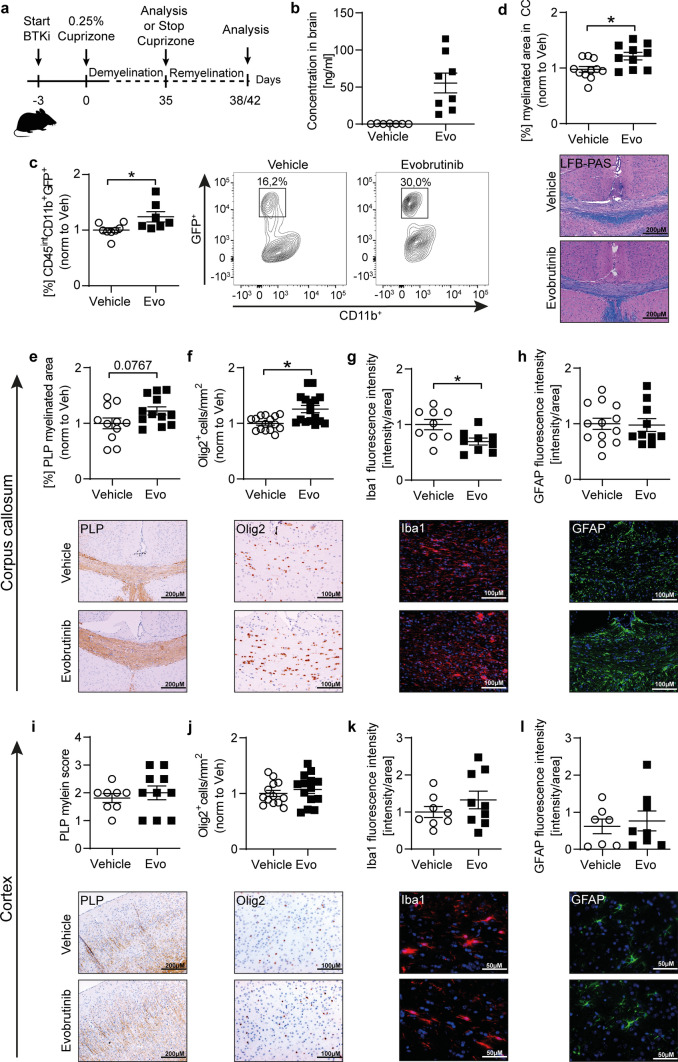
Fig. 7.
Evobrutinib induces myelin debris clearing in the cuprizone mouse model. a Overview of experimental setup. b Evobrutinib concentration in brain homogenates from C57BL/6 J mice, treated daily with 10 mg/kg evobrutinib or vehicle control started 3 days prior to simultaneously cuprizone diet for 5 weeks. The tissue was collected 30 min after the final dose. c CNP::eGFP transgenic mice were treated daily with 10 mg/kg evobrutinib or vehicle control started 3 days prior to simultaneously cuprizone diet for 5 weeks. Microglia were isolated from the brain and phagocytosis capacity was analyzed by flow cytometry and are shown as mean fluorescence intensity, (MFI, n = 7–8). d–l C57BL/6 J mice were treated daily with 10 mg/kg evobrutinib or vehicle control started 3 days prior to simultaneously cuprizone diet for 5 weeks followed by 3 days on regular chow. All brain sections were immunohistochemically stained and the corpus callosum (CC) as well as a defined area of the cortex were analyzed. d, e, i Myelinated areas were assessed by d luxol fast blue/periodic acid-Schiff (LFB/PAS) staining and e, i anti-myelin proteolipid protein (PLP) staining and are shown as percentage of myelinated CC in relation to the total CC (d, e) or scoring of the cortex area (i), scale bar: 200 µM. Immunostaining of (f, j) oligodendrocyte transcription factor 2 (Olig2), number of cells/mm2 per group, scale bar: 100 µM. g, k Microglia (Iba1) and h, l astrocytes (GFAP), fluorescence intensity in CC or cortex in relation to the total CC or cortical area, scale bar: 50/100µM. b–l Data are shown as mean ± standard error of the mean (SEM). Data are normalized to vehicle and pooled from at least two independent experiments (n = 12–16). Asterisks indicate significant difference calculated using the unpaired two-tailed t-test (*P ≤ 0.05, **P ≤ 0.01, ***P ≤ 0.001)

