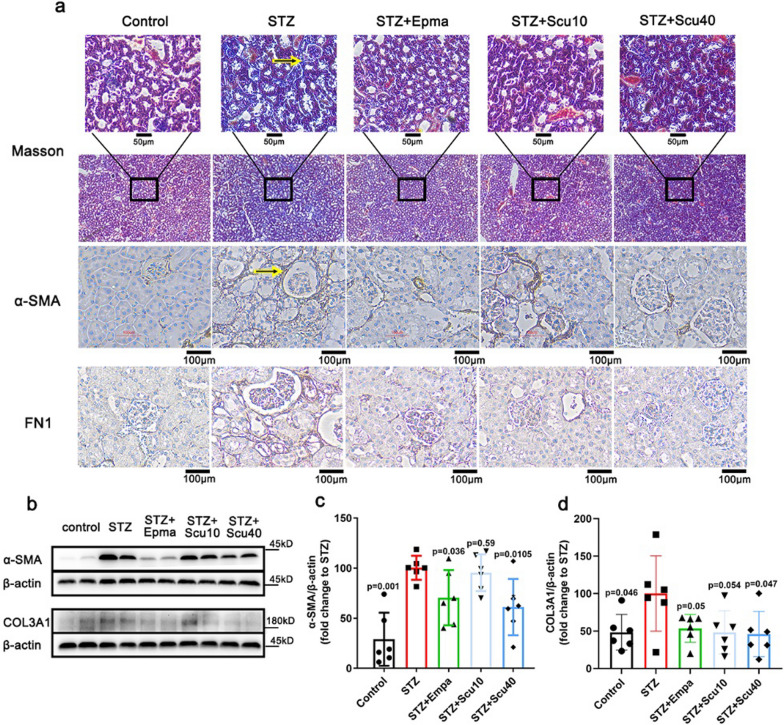
Fig. 2.
Scutellarin Improved Renal Fibrosis of the DN Mice. a Masson’s trichrome staining (× 200; scale bar = 50 µm) and immunohistochemistry staining for α-SMA and FN1 (× 200; scale bar = 100 µm) of the mice treated with vehicle, scutellarin or empagliflozin. b Representative western-blot images for α-SMA and Col3A1 of the mice. c, d Quantifications of the protein levels of α-SMA and Col3A1, respectively. β-Actin used as a loading control. All data are normalized to the STZ group and presented as the mean ± S.D.; n = 6 for each group, “n” stands for the number of animals; p vs. the model group (STZ)

