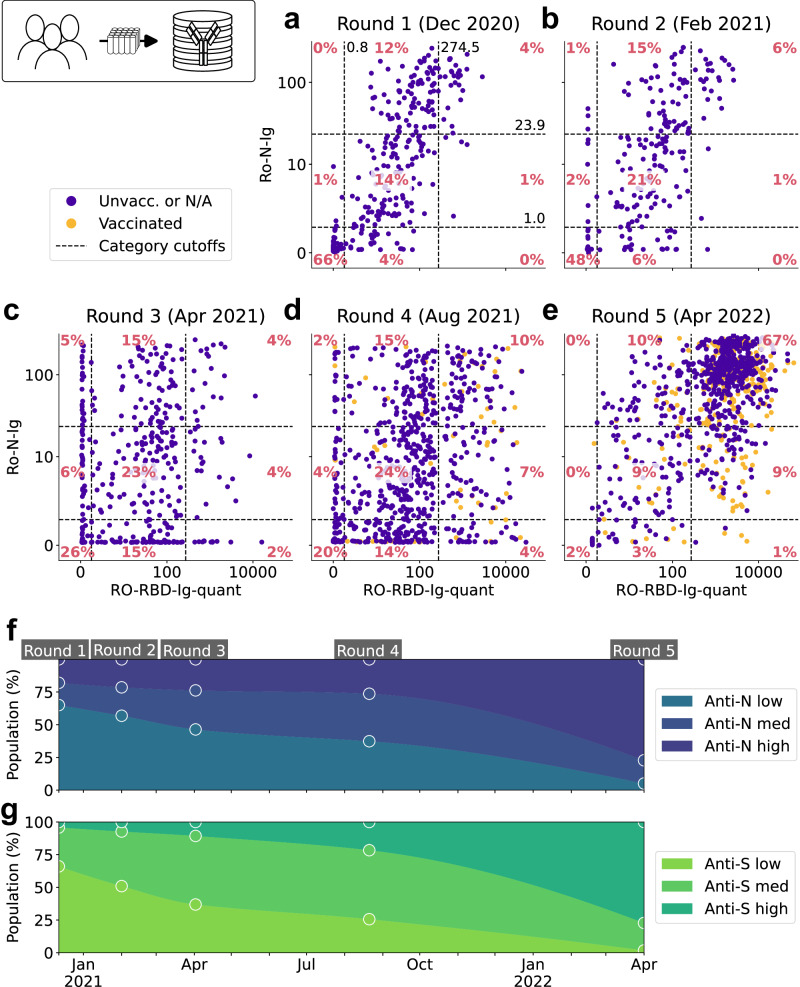
Fig. 1. Ro-N-Ig and Ro-RBD-Ig-quant measurements of five rounds of convenience sampled community members.
a–e Scatterplots displaying the relationship between levels of N- and S-specific antibodies across five rounds of measurement. Known vaccination status of each participant indicated by colors, cutoff levels indicated by dashed lines and percentages of people per category annotated in red. f–g Antibody levels over time between end of 2020 and April 2022. The observations are indicated by circles and the trend is indicated via smoothing splines constructed on the basis of these data. Source data are provided as a Source Data file.

