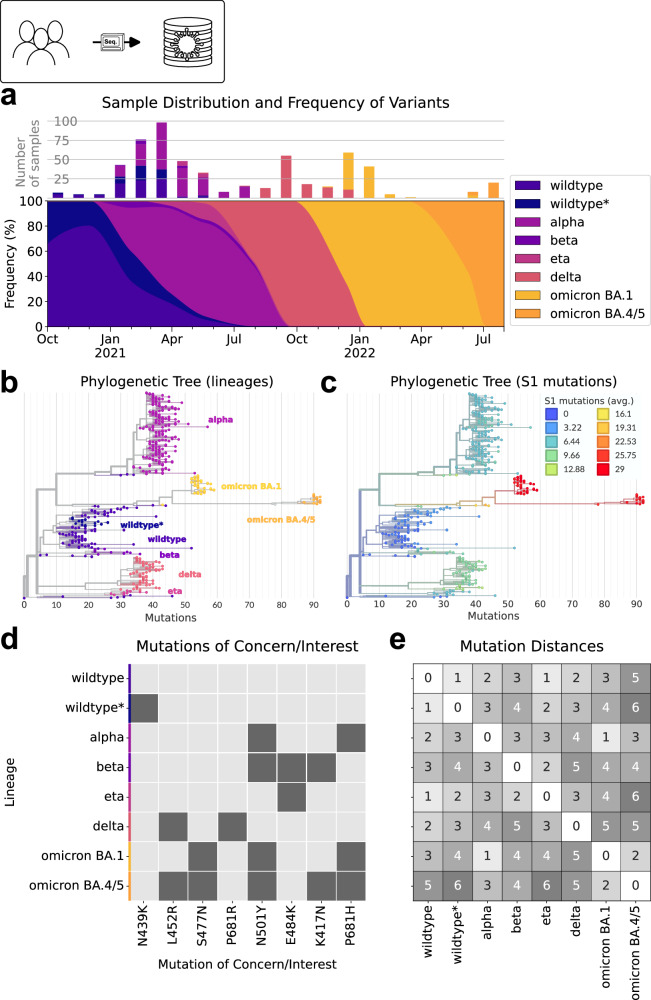
Fig. 2. Sequencing results of samples obtained between October 2020 and July 2022.
a Number of successfully sequenced samples, variant frequency and smoothed variant time-course. Variants are indicated using colors. b,c Phylogenetic tree of the sequenced samples, illustrating the relationships between variants and their sub-variants (full list of variants in Supplementary Information Table SN1). Distance between variants represented by overall difference in their mutations. Lineage groups b and number of mutations in the spike protein c highlighted by color. d Heatmap indicating which variants possess specific mutations of interest on their S1 protein. e Heatmap depicting MOIC mutation distances with respect to mutations of interest between different variants. Distance indicated by gray scale. Source data are provided as a Source Data file.

