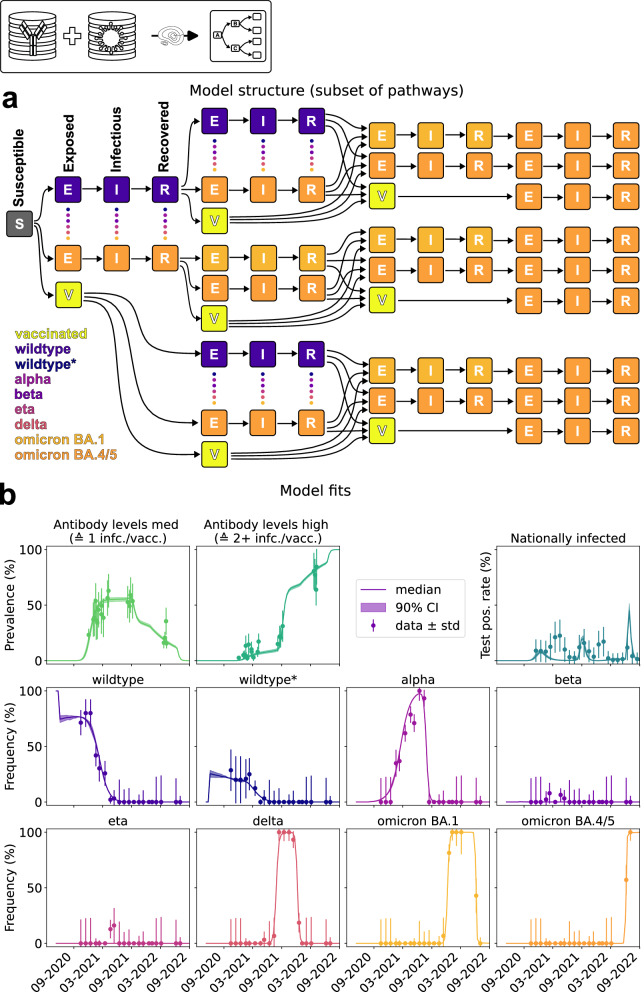
Fig. 3. Structure and fitting results of the multivariant model.
a Model structure depicting up to four consecutive infections/vaccinations. Potential infection pathways labeled by the stages S(usceptible), E(xposed), I(nfectious) and R(ecovered) and their respective variants highlighted by different colors. Only a small subset of the in total more than 350 possible paths is shown. b Model fitting results shown by progression of all observables against their respective (mean) measurements. Bayesian 90% credibility intervals for model simulation obtained by sampling included as well as the standard deviation of the measurements. Prediction simulations performed on n = 6001 parameter samples after burn-in from Markov chain Monte Carlo. Sample sizes of data points provided in Supplementary Note 2 (Table SN4). Source data are provided as a Source Data file.

