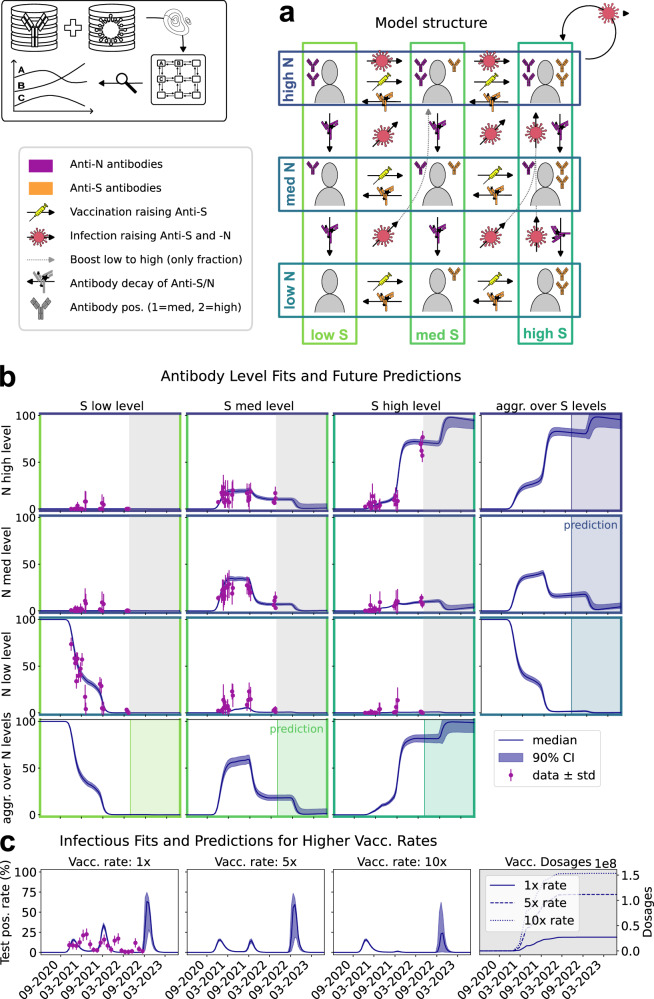
Fig. 5. Modeling, fitting results and predictions of antibody-category model.
a Model structure of different antibody category levels and transmission between them. Antibody levels against N or S, respectively, are indicated by colors. b The inner grid presents the fitting results to mean measurements (with standard deviations) along with 90% confidence bands derived from parameter sampling. The aggregated levels of Anti-S and Anti-N antibodies are displayed in the lower row and right column, respectively. The prediction phase, where no new antibody data was measured, is highlighted. c First plot showing the fit of simulated incidences to measured national test positivity rates (mean and standard deviation taken per month). Second and third plots illustrating predictions of test positivity rates under hypothetical scenarios with vaccination rates 5 and 10 times as high as the actual rate. Last plot showing how different vaccination rates translate to vaccinated dosages. b, c Prediction simulations performed on n = 30,001 parameter samples after burn-in from Markov chain Monte Carlo. Sample sizes of data points provided in Supplementary Note 3 (Table SN7). Source data are provided as a Source Data file.

