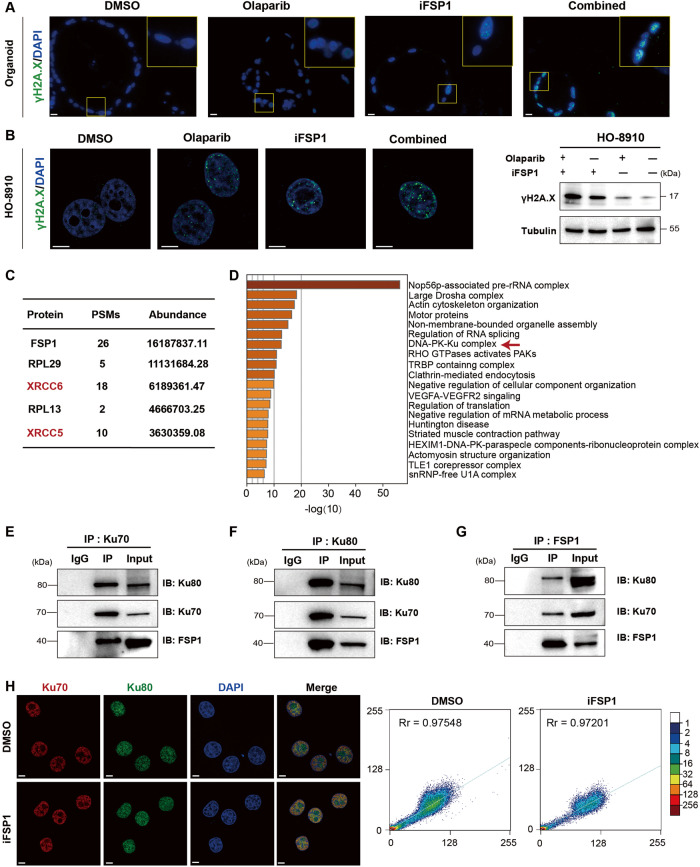
Fig. 5. FSP1 interacts physically with Ku70/Ku80 complex.
A, B Representative images of the immunofluorescent staining of γH2A.X in response to the treatment of DMSO, Olaparib, iFSP1 and in combination in the PDO (A) and the HO-8910 cells (B). Scale bar: 20 μm and 5 μm, respectively. Immunoblots analysis of γH2A.X in each group in HO-8910 cells (B). C, D The Co-IP with anti-FSP1 antibody in the HEK293t cells was subjected to the mass spectrometry (MS). The sorted proteins and their peptide-spectrum matches (PSMs) and abundance were listed (C). The enrichment analysis of the annotated proteins in the MS results was performed through Metascape (D). E‒G Interactions between FSP1,Ku70 and Ku80 proteins in HEK293t cells were determined by IP with IgG (control), anti-Ku70 (E), anti-Ku80 (F) or anti-FSP1 (G) antibody through immunoblot analysis with the indicated antibodies. H The nuclear colocalization of Ku70 with Ku80 protein was determined by confocal fluorescence microscopy. Scale bar: 5 μm.

