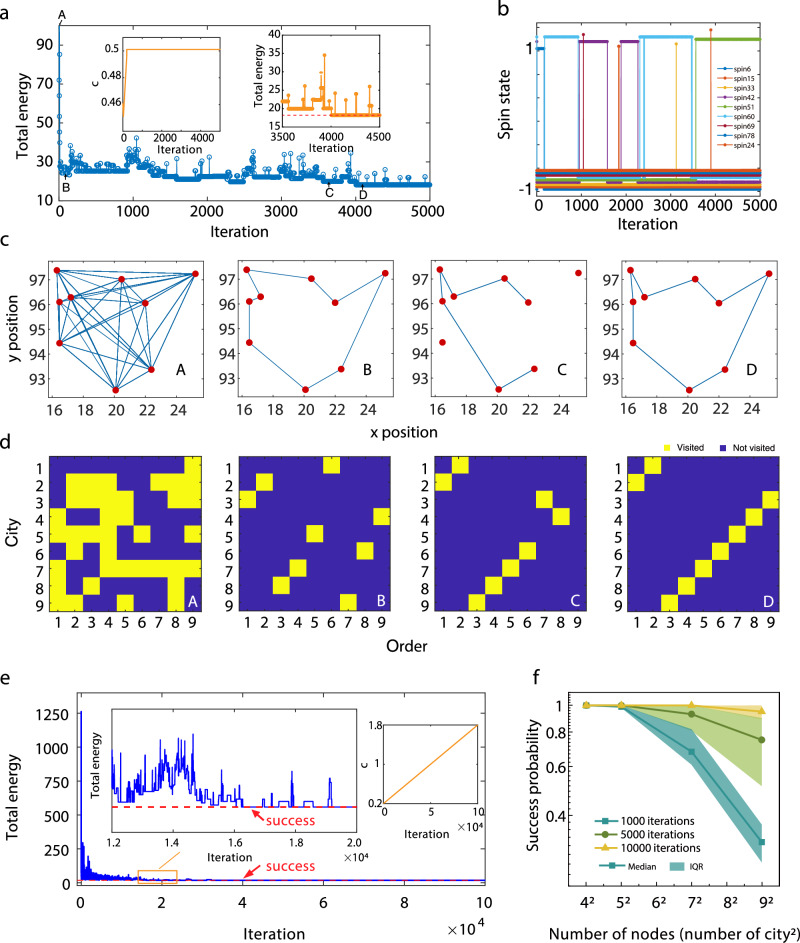
Fig. 3. Solution to 9-city TSP.
a Total energy transition of 9-city TSP with 5000 iterations (the optimal solution with the energy of 18.23 corresponds to the dashed horizontal line). Insets: effective inverse temperature (c) and total energy within 3500–4500 iterations. b Evolution of 9 representative SMTJ states in 5000 iterations. An offset is used in the y-axis to show each SMTJ clearly. c Visiting routes of state A, B, C, and D in a. d Corresponding Ising spins of state A, B, C, and D in a. The yellow squares represent ‘visited ()’ and the purple squares represent ‘not visited ()’. e Total energy transition with increasing c from 0.2 to 1.8. Left inset: zoom-in view of total energy transition with increasing c from 0.392 to 0.52. Right inset: transition of c with iterations. The red dashed line represents the optimal path (success). f Success probability of solving TSP with varying the node size. The data points and shadows represent the median value and the interquartile range (IQR), respectively.

