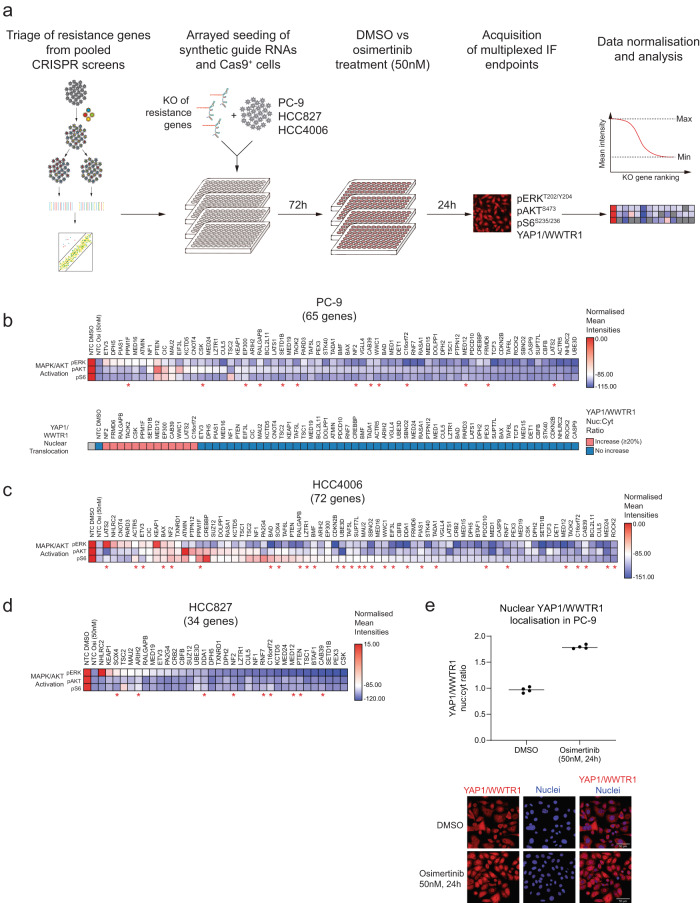
Fig. 2. High-content microscopy and CRISPR demonstrate that the Hippo pathway is an important component of the osimertinib resistance landscape.
a Assay setup for an arrayed CRISPR KO screen combined with high-content microscopy. Pools of synthetic guide RNAs targeting selected resistance hits from genome-wide screens were transfected in stably Cas9 expressing cell lines PC-9, HCC827, and HCC4006 and cultured for 72 h. Subsequently, cells were treated for 24 h with DMSO or osimertinib (50 nM). In a multiplexed approach, cells were imaged for expression of pathway markers pAKT (S473), pERK1/2 (T202/Y204), and pS6 (S235/236) as well as for nuclear localisation of the transcriptional co-activators YAP1/WWTR1 (Hippo pathway). Results were analysed using a max/min normalisation for pAKT, pERK1/2, and pS6, or the nuclear vs. cytoplasmatic ratio of YAP1/WWTR1 expression. (b-d) The normalised effect of KO genes on pathway reactivation compared to DMSO (=0) or osimertinib-treated cells (= −100) (upper heatmap for each cell line). The first two columns in the upper heatmap for each cell line show the effect of osimertinib treatment alone on pERK, pAKT, and pS6 expression, to allow comparison with the effect of gene KO. In addition, red asterisks indicate genes that also show increased nuclear localisation of YAP1/WWTR1 after KO of resistance genes. All analyses are based on at least two replicates. (e) Increased nuclear vs. cytoplasmic YAP1/WWTR1 expression in PC-9 cells at 24 hours post osimertinib treatment. The method to calculate this is detailed in Methods.

