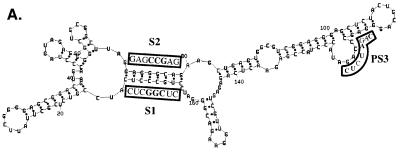
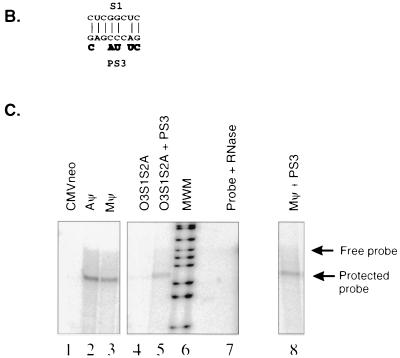
FIG. 6.
(A) The sequence of O3S1S2A+PS3. The sequences that differ from that of the wt O3 stem are highlighted. The PS3 region is outlined, and the sequences mutated in O3S1S2A+PS3 are indicated. (B) The predicted base pairing between S1 and PS3 in the O3S1S2A mutant. The nucleotide changes in the O3S1S2A+PS3 mutant are shown in boldface below the PS3 sequence. (C) RNase protection analysis of the RNA from virus released from G418-resistant mass cultures of Q2bn-4D cells transfected with plasmids, as indicated above each lane, and annealed to the neo probe. The expected sizes of the free probe and the protected neo probe are indicated by arrows. The sample in lane 7 had no viral RNA added.


