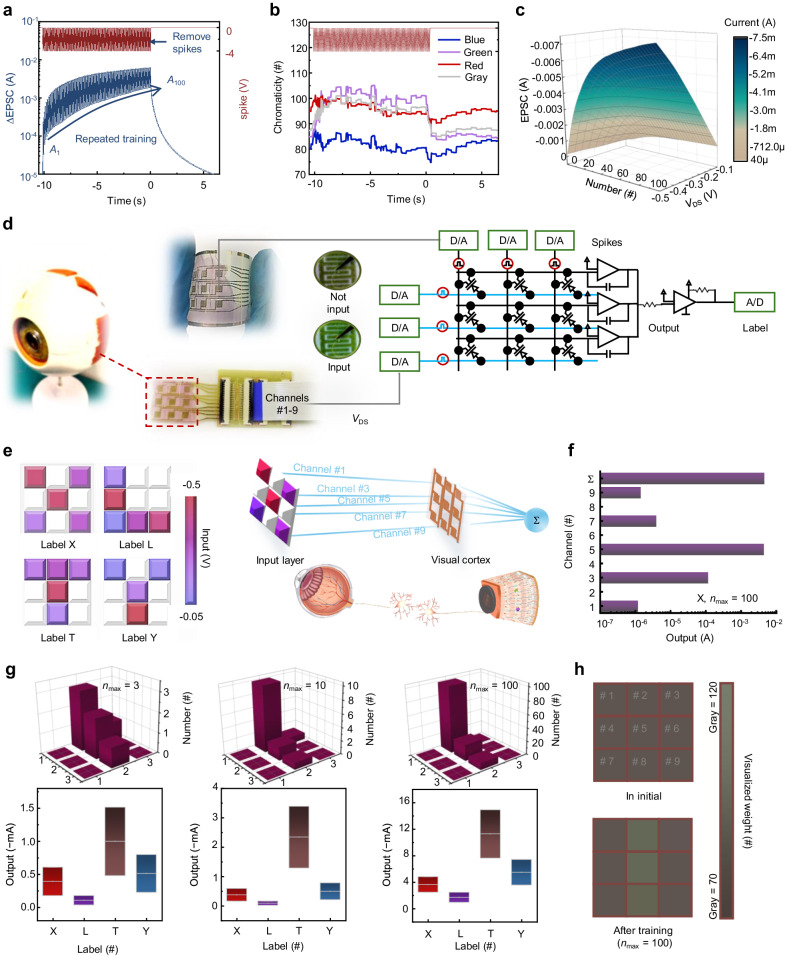
Fig. 3. A visualized pattern-recognition network.
a ∆EPSC triggered by 100 spikes of −4 V. b Chromaticity of three primary colors and gray extracted from nine sampling points triggered by 100 spikes of −4 V. c Current (EPSC)-spike number-voltage (VDS) contour map of the ENT device. d Diagram of a 3 × 3 ENT array for visualized visual cortex. e Classification of 3 × 3-pixel images of X, L, T and Y, where the pixels are read by VDS of input neurons and processed by pulses from biomimetic visual cortex. f Schematic of the response of each channel output and total output in an example of image X, under nmax = 100. g With different nmax, the optimal number of pulses applied to each input neuron, and the range of output value for each image category. Box plots indicate standard deviations of output value. h Visualized weight changes in initial and after training with nmax = 100.

