
Fig. 2. Heat map of similarity of cds nucleotide sequences (a) and amino acid sequences (b) of R gene homologs in PCPS with the reference sequences of R genes.
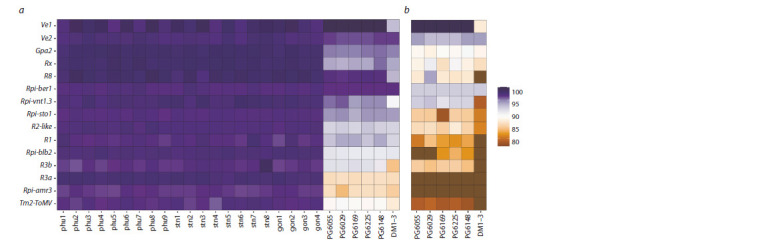
The color scale represents the level of similarity with the reference gene.
Official websites use .gov
A
.gov website belongs to an official
government organization in the United States.
Secure .gov websites use HTTPS
A lock (
) or https:// means you've safely
connected to the .gov website. Share sensitive
information only on official, secure websites.
The color scale represents the level of similarity with the reference gene.