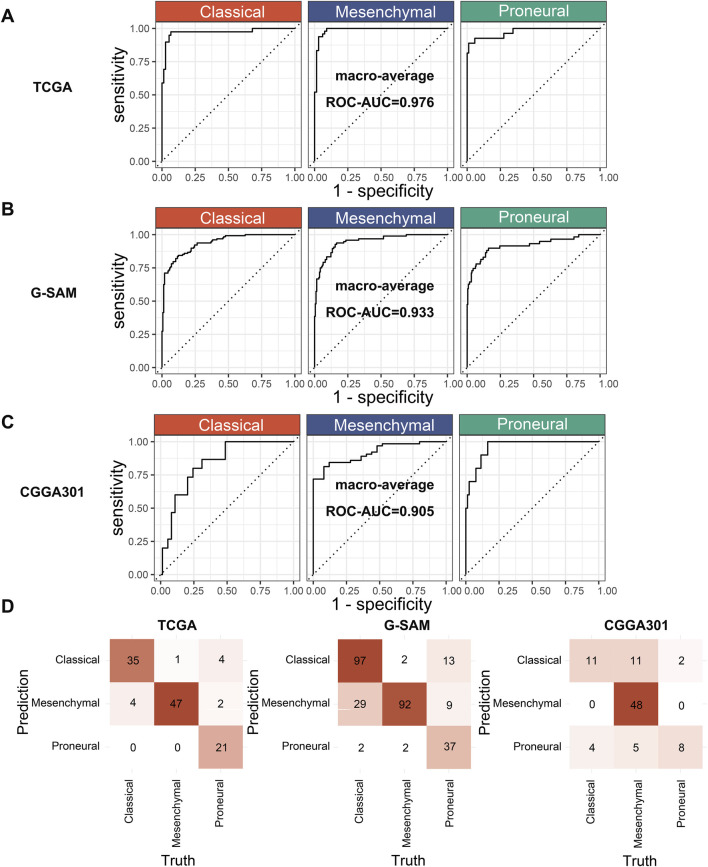
FIGURE 7.
Performance evaluation of the optimal model. (A) ROC curves of the XGBoost.Enet-stacking-Enet model in the training cohort (TCGA). (B, C) ROC curves of the XGBoost.Enet-stacking-Enet model in the test cohort (G-SAM, CGGA301). (D) Confusion matrix of the XGBoost.Enet-stacking-Enet model on the training and test cohorts.

