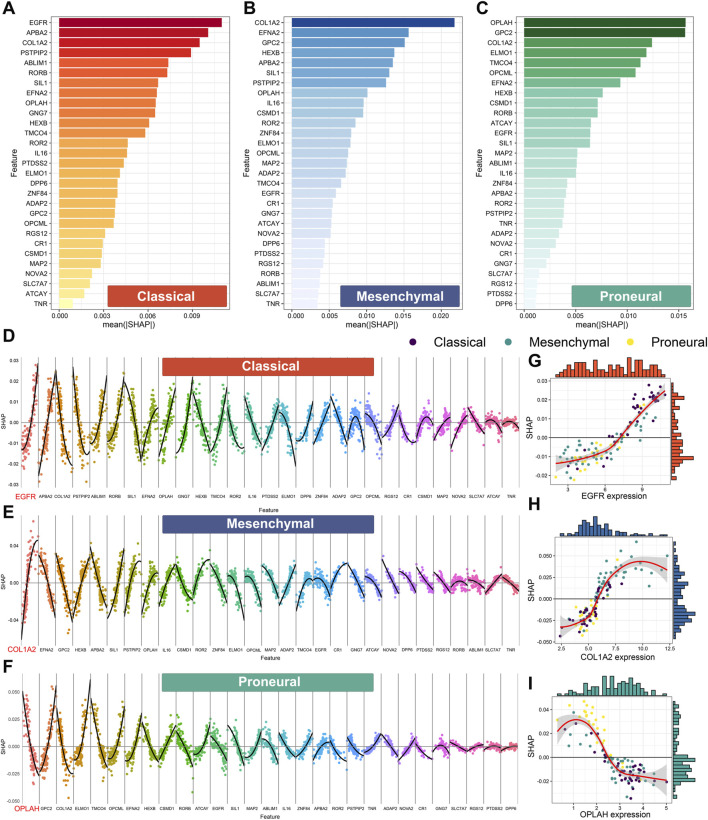
FIGURE 8.
Feature importance based on Shapley additive explanation (SHAP) analysis of the XGBoost.Enet-stacking-Enet model. Feature importance for the prediction of the classical subtype (A), the mesenchymal subtype (B), and the proneural subtype (C). The features are ranked from most important to least important on the vertical axis, ordered from top to bottom. The horizontal axis shows the mean absolute SHAP values in all samples in the TCGA cohort. The higher absolute SHAP values mean higher importance. Feature contribution for the prediction of the classical subtype (D), mesenchymal subtype (E), and proneural subtype (F). The non-linear relationship between the expression level of EGFR (G), COL1A2 (H), OPLAH (I), and SHAP value. The horizontal axis represents the feature expression values of each feature ordered from low to high in each feature. SHAP values are presented on the vertical axis. A SHAP value higher than 0 implicates positive contributions to the corresponding subtype prediction, and SHAP values less than 0 indicate negative contributions to the corresponding subtype prediction.

