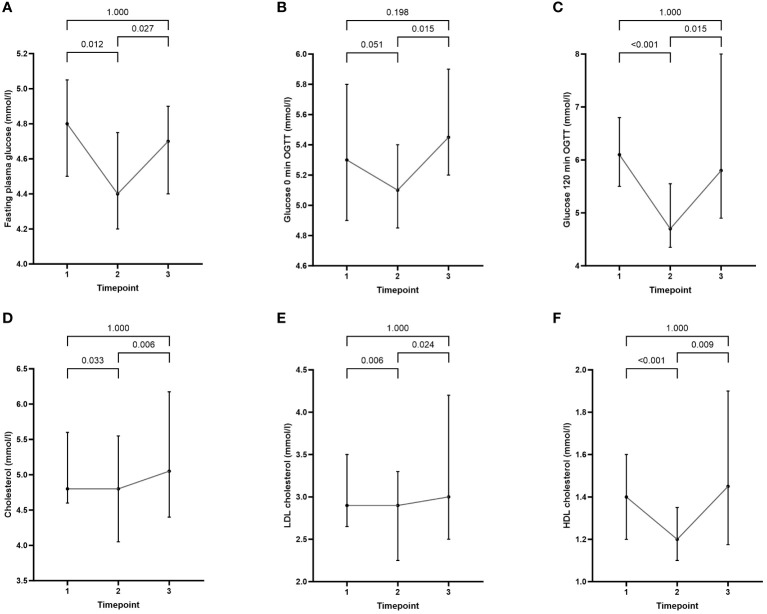
Figure 3.
Comparison of cardiometabolic parameters at baseline (timepoint 1) with values at the end of semaglutide intervention (timepoint 2) and at the end of the study (timepoint 3): (A) fasting plasma glucose, (B) glucose 0 min OGTT, (C) glucose 120 min OGTT, (D) cholesterol, (E) LDL cholesterol, and (F) HDL cholesterol. Data are presented as median (25%-75%).

