. 2024 Apr 24;11(1):e001907. doi: 10.1136/bmjresp-2023-001907
© Author(s) (or their employer(s)) 2024. Re-use permitted under CC BY. Published by BMJ.
This is an open access article distributed in accordance with the Creative Commons Attribution 4.0 Unported (CC BY 4.0) license, which permits others to copy, redistribute, remix, transform and build upon this work for any purpose, provided the original work is properly cited, a link to the licence is given, and indication of whether changes were made. See: https://creativecommons.org/licenses/by/4.0/.
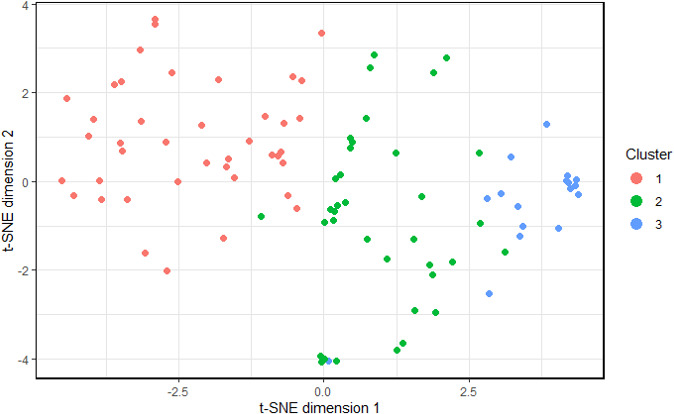
Figure 1.

t-SNE plot showing the separation of the clusters projected on a 2-dimensional space.
