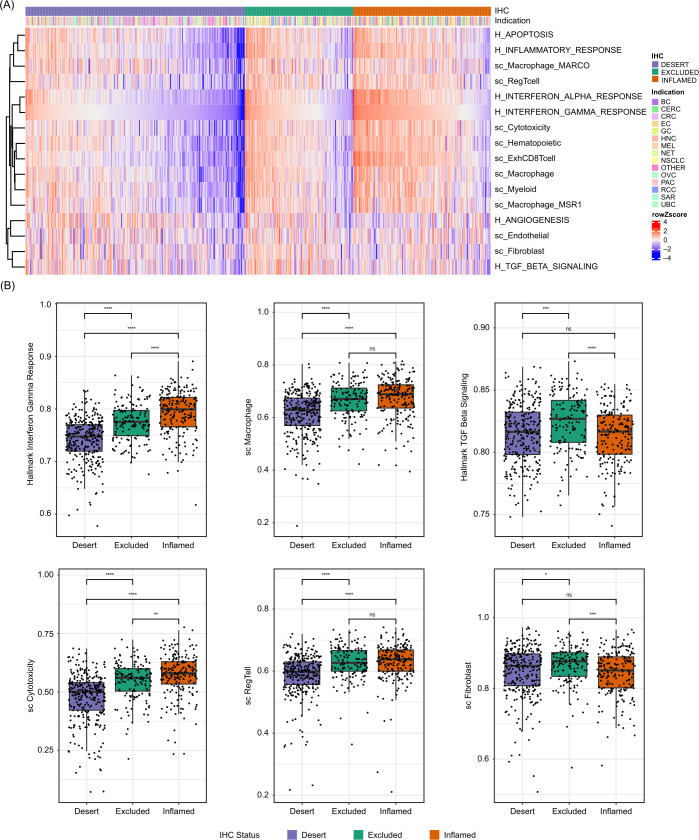
Figure 2.
Inflamed, excluded and desert samples show distinct transcriptional profiles. (A) Heatmap showing relative signature scores per sample, sorted according to CD8 immunophenotype and “interferon gamma” signature scores; cancer types are displayed. (B) Selected signature scores across CD8 immunophenotype classes. “H_” represents pathway-specific signatures (Hallmark), while “sc_” represents cell-type specific signatures. *p≤0.05. **p≤0.01. ***p≤0.001. ****p≤0.0001. CRC, colorectal cancer; IHC, immunohistochemistry; ns, not significant; NSCLC, non-small-cell lung cancer; UBC, urinary bladder cancer.

