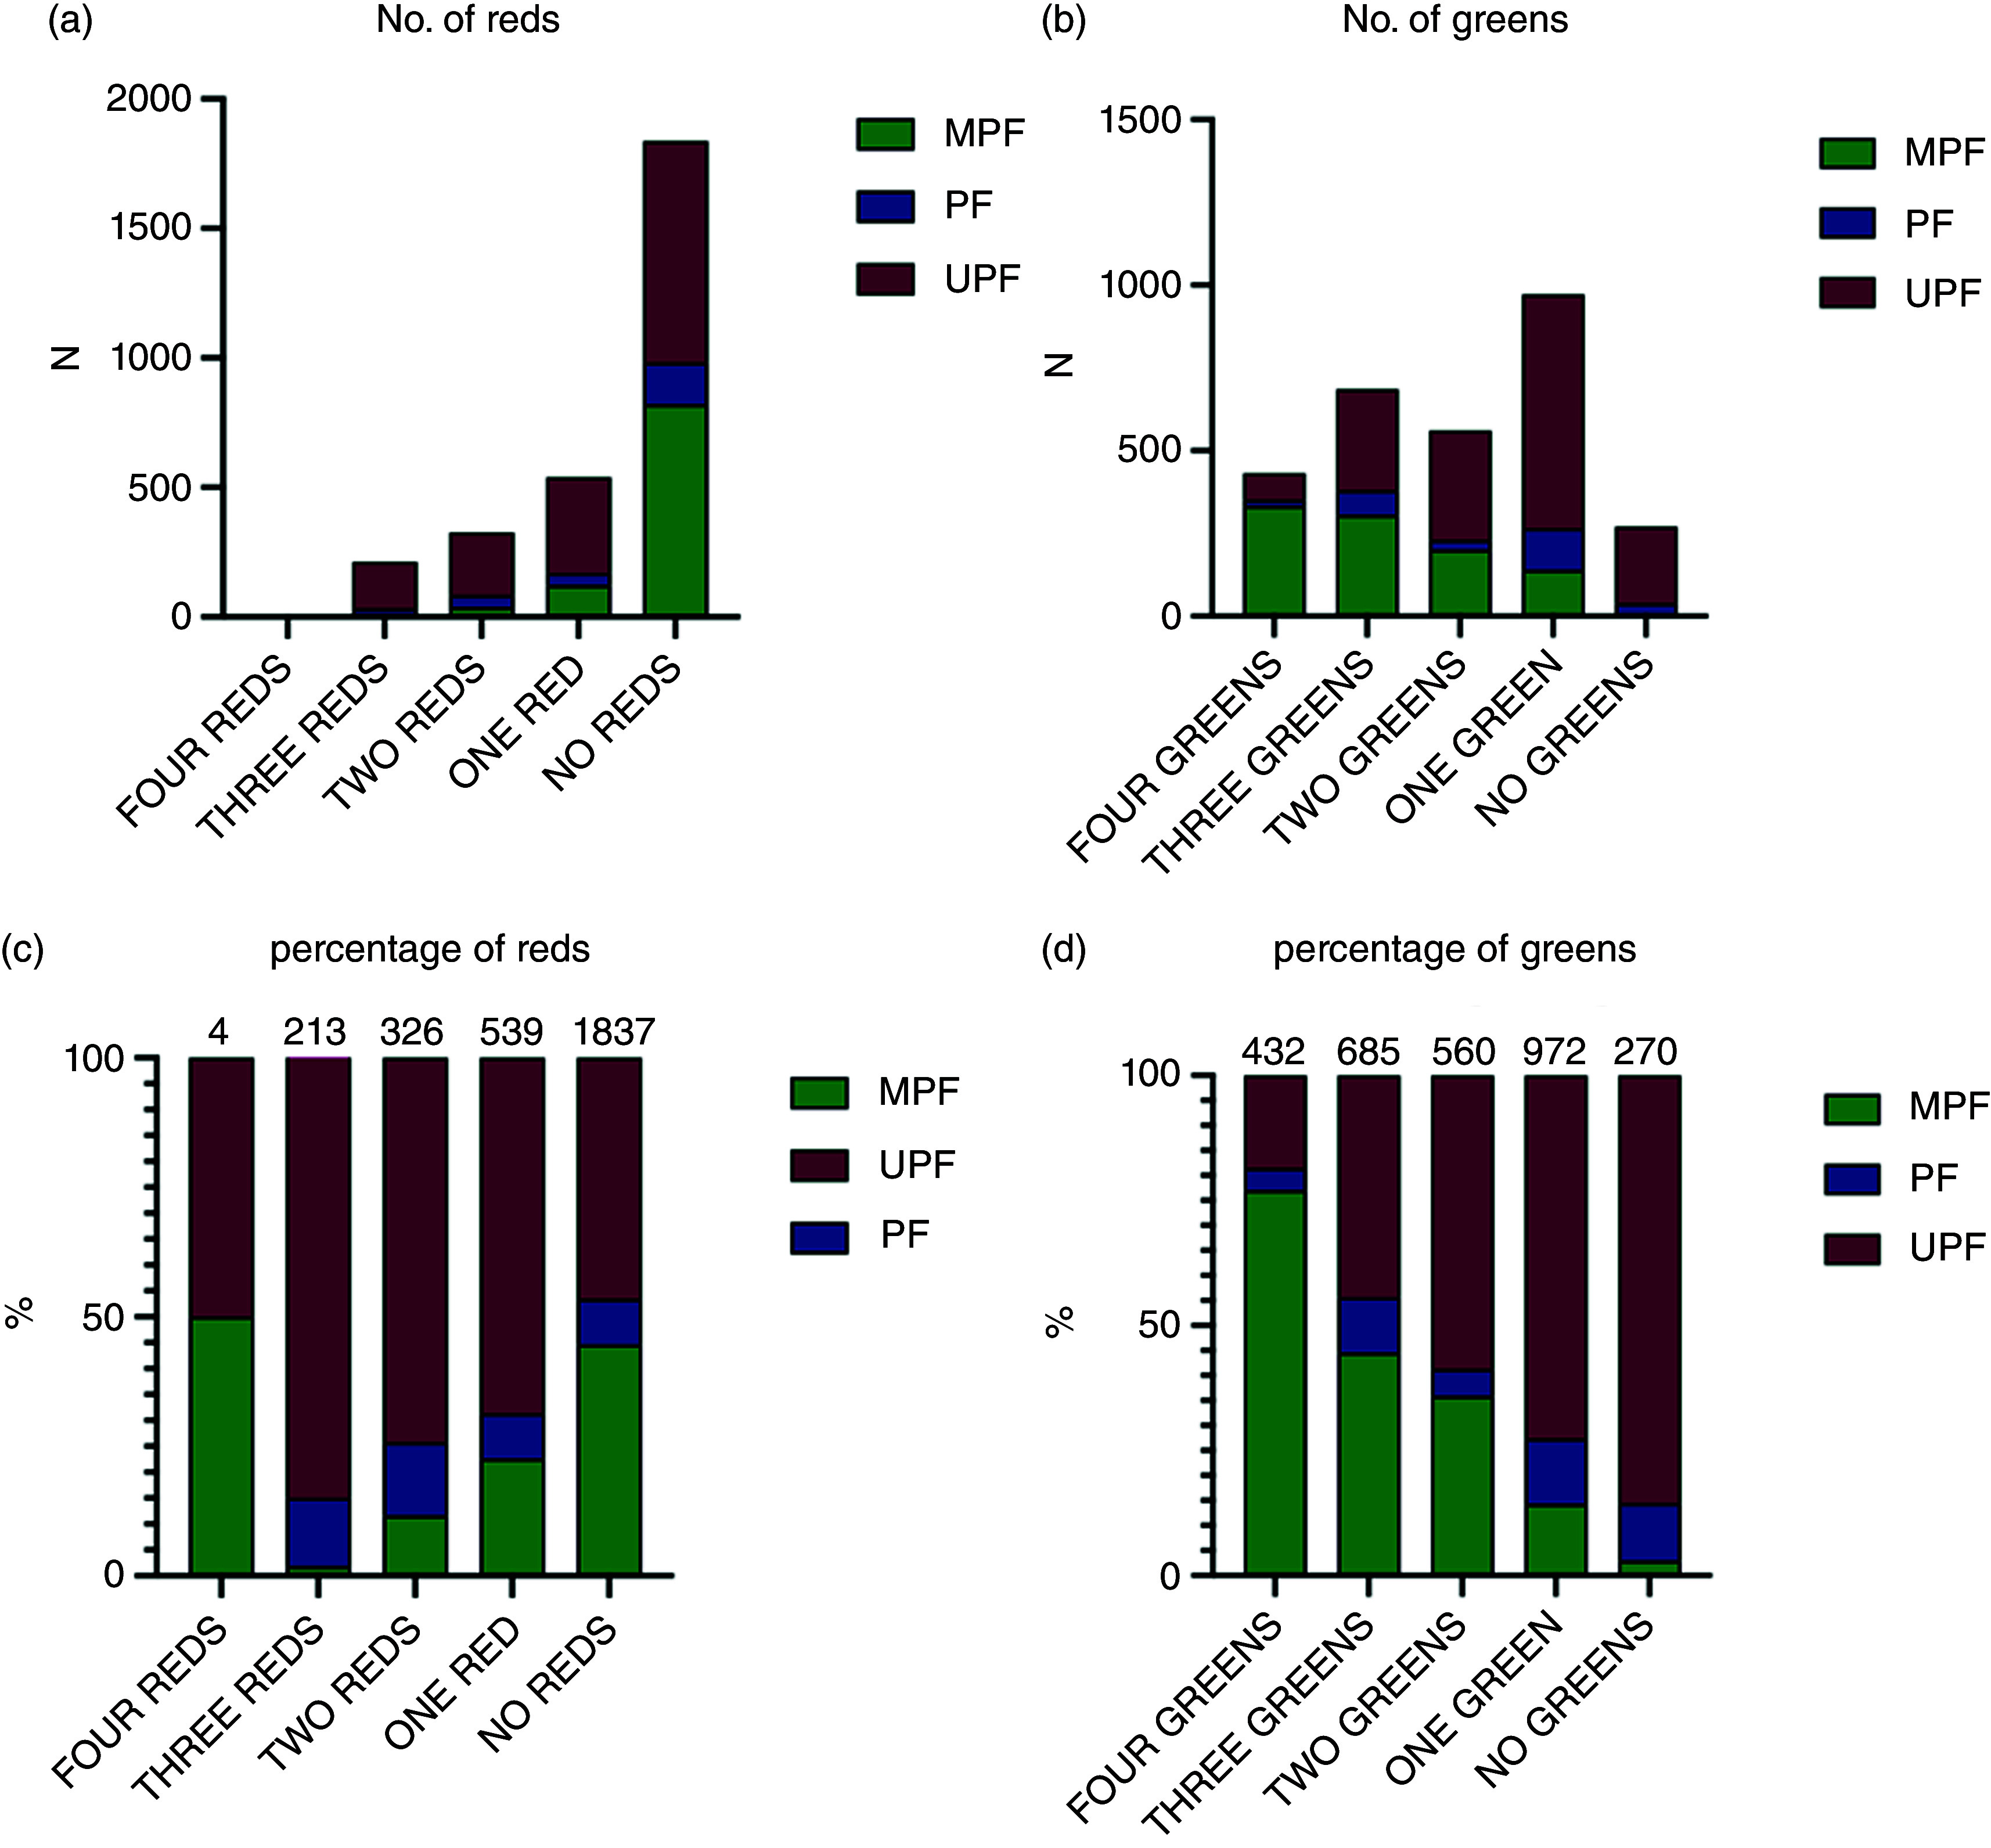
Fig. 3.

The number (a) and (b) and percentage (c) and (d) of total red (a) ad (c) or green (b) and (d) FOPL traffic lights for fat, saturated fat, total sugar and salt, stratified by NOVA group. MPF n 986; PF n 283; UPF n 1650. Numbers above columns in Figures 3(c) and (d) denote the number of items. FOPL, front of package label; MPF, minimally processed food; PF, processed food; UPF, ultra-processed food.
