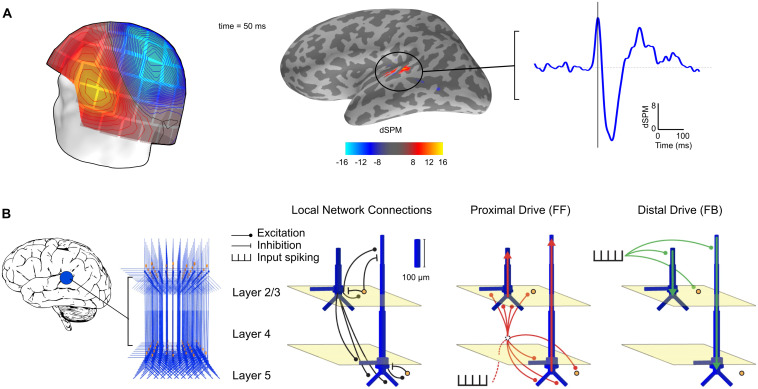
Figure 1.
Source estimation and computational modeling of MEG data. A, An example of MEG data. Auditory evoked MEG sensor data (left) in one subject at 50 ms after auditory stimulus onset (isocontour line step 5.0 fT) are shown with the corresponding noise-normalized MNE (dSPM) source estimate over an inflated cortical surface (middle) and the estimated time course for the left hemisphere auditory cortex (right, vertical line at 50 ms). B, The HNN model. The MEG response is modeled using a network of neurons in a local cortical area (left). Local network structure (right) consists of pyramidal cells (blue) and interneurons (orange). Excitatory and inhibitory coupling is indicated by a circle and a bar, respectively. The network is activated by proximal (red) and distal (green) drives by input spike trains. Modified from Neymotin et al. (2020).

