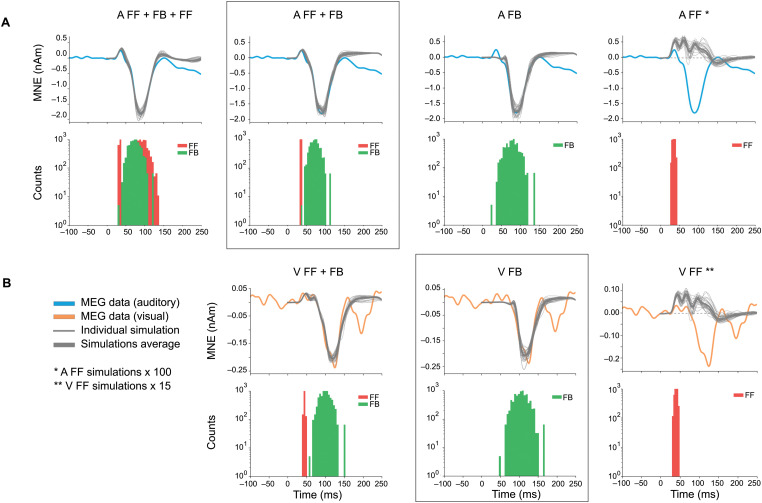
Figure 7.
Alternative models for auditory (A) and visual (B) responses. The main models (auditory, FF + FB, and visual, FB) are framed. The experimentally observed MEG source waveforms (blue, auditory stimulus; orange, visual stimulus) are overlayed with the simulated waveforms (thin gray, 10 individual simulation runs; thick gray, average of the individual runs). Histograms below the waveforms show the temporal distribution of FF (red) and FB (green) inputs to the HNN model of the auditory cortex neural circuit. In rightmost column, FF only simulations are additionally scaled (auditory ×100, visual ×15) to illustrate their waveforms compared with the MEG signal: However, the optimal non-negative scaling factor in these cases was actually 0 (dashed line).

