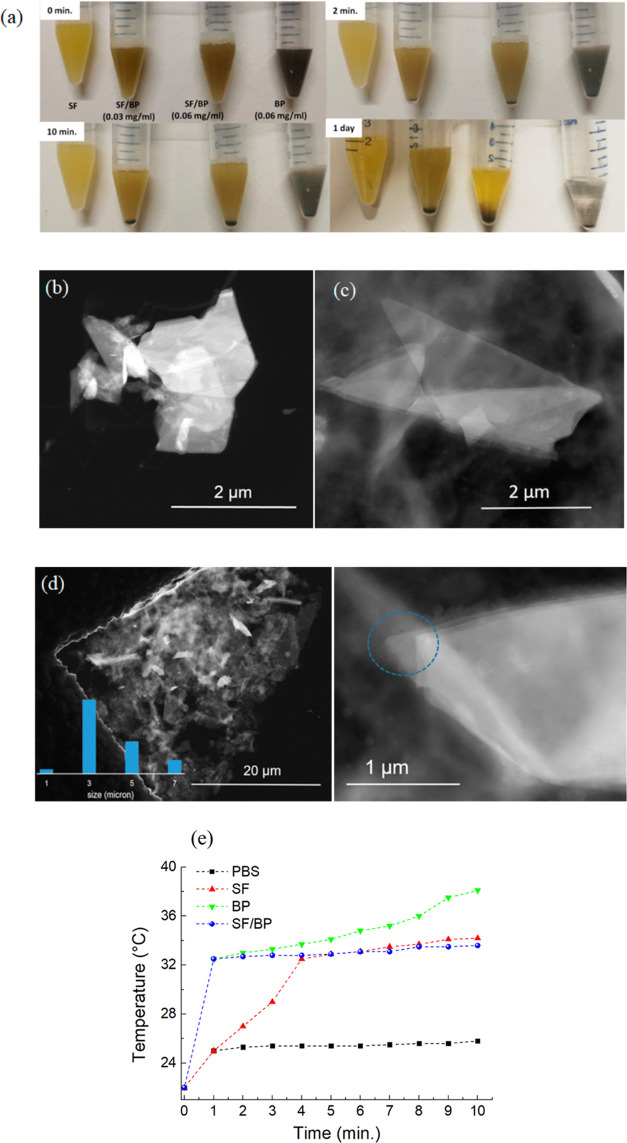
Figure 6.
(a) Photographs of SF, SF/BP, and BP after storage in PBS for different periods of time. Dark-field STEM images of (b) BP dispersed in PBS and (c) SF/BP dispersed in PBS. (d) STEM dark-field image of SF/BP in PBS. Left: panoramic view with the inset showing the relative size distribution; right: edges of a selected BP flake, showing the superimposition of layers. (e) Photothermal heating curves of BP, SF, and SF/BP after dissolving in PBS for 2 h and being irradiated with 50 W cm–2 for 10 min. The heating curve of neat PBS is also reported as a reference.

