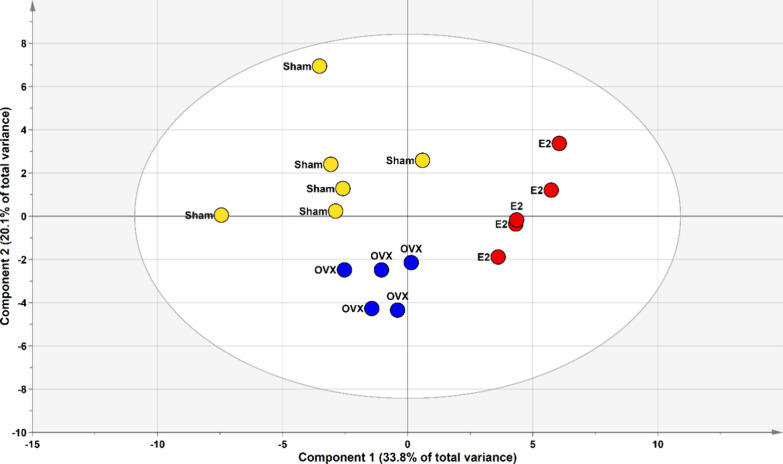
Figure 2.
Score plot of the PCA model obtained from 44 metabolites in the plasma samples of the mice from the sham, OVX, and E2 groups (yellow, sham; blue, OVX; red, E2). Sham, sham-operated mice; OVX, ovariectomized mice; and E2, ovariectomized mice that received twice-weekly supplementation of 17β-estradiol.

