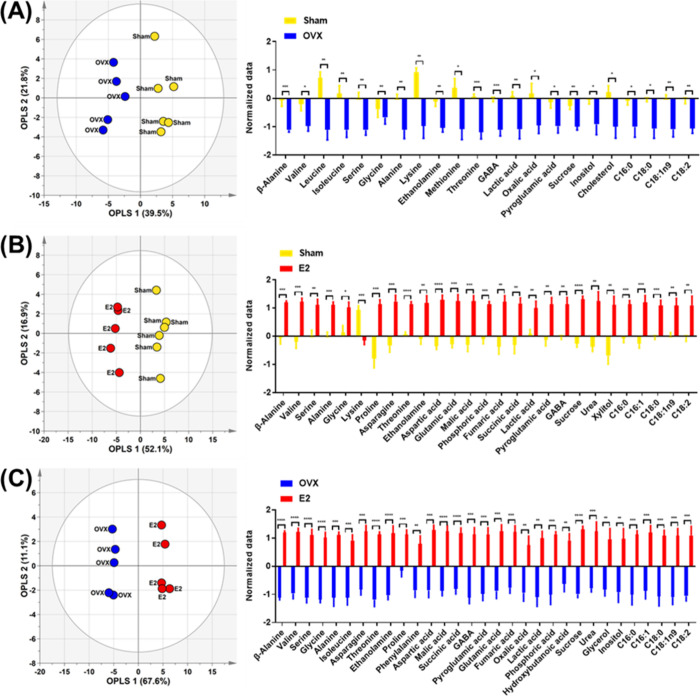
Figure 5.
OPLS-DA model score plot and Student’s t-test bar graphs based on the 45 metabolites obtained from the brain samples of the mice from the (A) sham and OVX groups, (B) sham and E2 groups, and (C) OVX and E2 groups. Sham, sham-operated mice; OVX, ovariectomized mice; and E2, ovariectomized mice that received twice-weekly supplementation of 17β-estradiol. *p < 0.05, **p < 0.01, ***p < 0.001, ****p < 0.0001.

