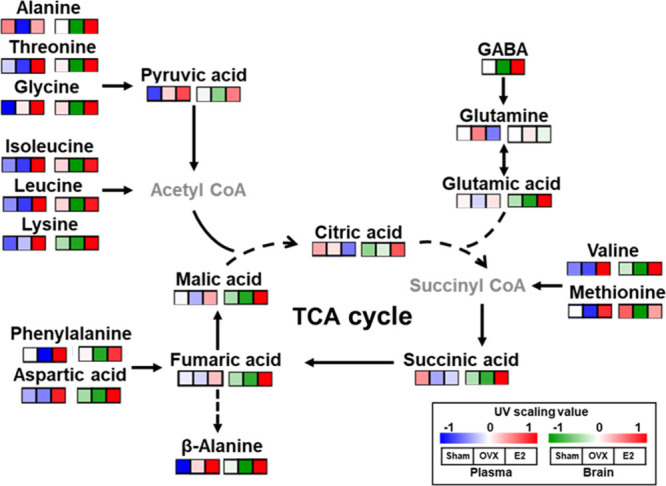
Figure 6.

Overview of metabolic alteration in serum and brain affected by 17β-estradiol supplementation in the OVX mouse model. Metabolites with p < 0.05 are shown in normalized data using UV scaling. UV scaling values range from −1.0 to 1.0. Each square is represented as the mean of the normalized data. Red indicates normalized values greater than 0, blue or green indicates normalized values less than 0, and gray indicates undetected metabolites. Sham, sham-operated mice; OVX, ovariectomized mice; and E2, ovariectomized mice that received twice-weekly supplementation of 17β-estradiol.
