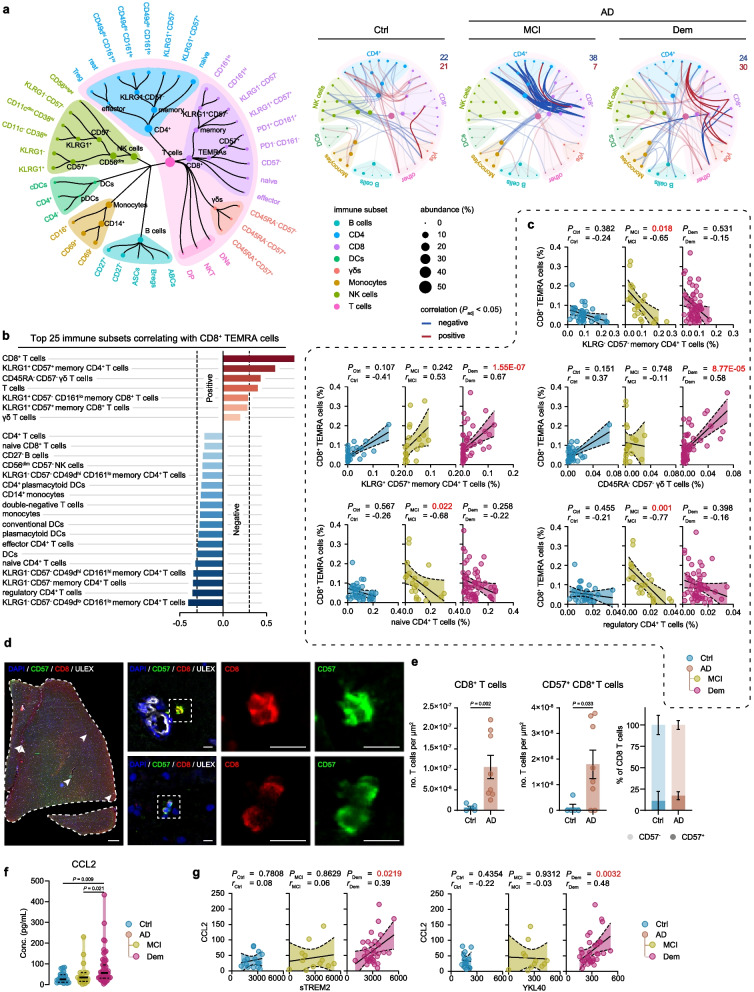
Fig. 2.
Peripheral CD8+ TEMRA cells are inversely correlated to CD4+ T cell subsets in AD patients. a Spearman correlation network of immune populations with nodes visualizing immune subsets and lines representing correlation coefficients for unique relationships between clusters. The size of the nodes represents the abundance of the population, and the color nodes represent the immune parent. Blue lines and red lines represent respectively negative and positive correlations between connected immune subsets. Darker colors present correlations with CD8+ TEMRA subsets. b Graph displays the 25 strongest Spearman correlations between CD8+ TEMRA cells and other immune subsets within the cohort. c Correlation graph showing Spearman's rho correlation with age/sex correction of CD8+ TEMRA cells with selected immune cell populations. Graph shows linear regression ± 95% confidence intervals. d Representative immunohistochemical staining of CD57+ CD8+ T cells in the middle temporal gyrus. The merged overview shows DAPI (blue), ULEX (white), CD8 (red), and CD57 (green). A magnified image shows the separate channels of CD57 and CD8. Scale bar = 1 mm for overview and 10 μm for magnifications. e Bargraph showing the total number of CD8+ and CD57+ CD8+ T cells in the middle temporal gyrus. Bargraphs show mean ± SEM, Mann–Whitney test. f Violin plot displaying the concentration of CCL2 in blood plasma using a GLM with age and sex as covariates. g Correlation graph showing correlations of CCL2 with sTREM2 and YKL40. Graph shows linear regression ± 95% confidence intervals, Spearman's rho correlation with age/sex correction. a-c n = 35 of control, n = 21 of MCI due to AD, n = 57 of Dem. d-e n = 5 of control, n = 8 AD. a-e. f-g n = 24 of control, n = 19 of MCI due to AD, n = 55 of Dem. GLM = multivariate general linear model; Ctrl = Control, MCI = mild cognitive impairment; Dem = dementia; AD = Alzheimer’s disease; TEMRA = effector memory CD8+ T cell re-expressing CD45RA

