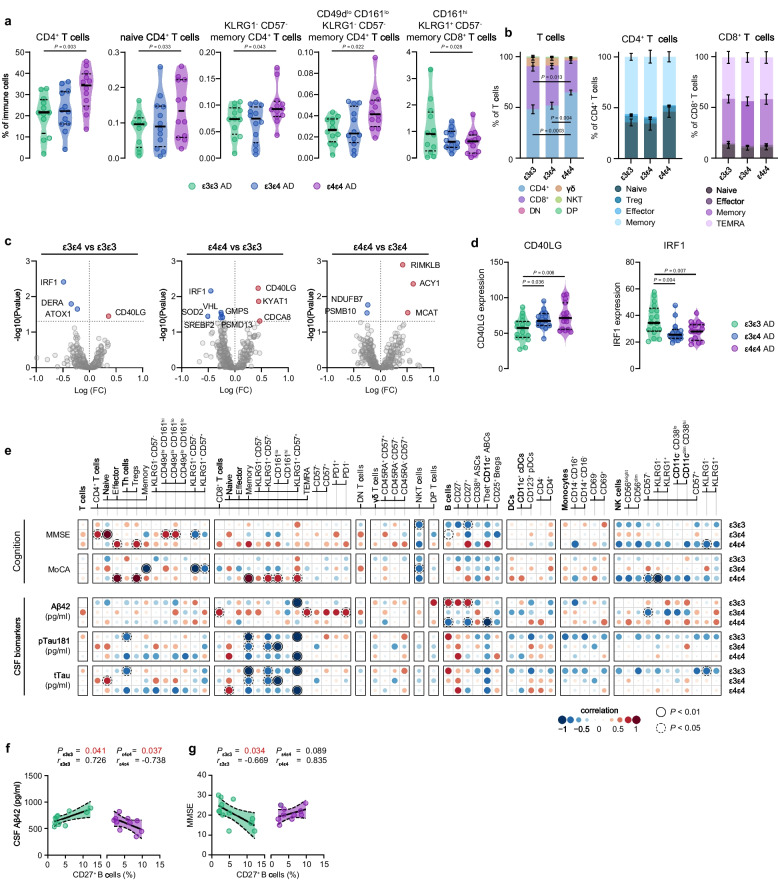
Fig. 4.
Influence of APOE status on peripheral immunity in AD patients. a Violin plots displaying the percentage of the annotated immune cell population out of the total CD45+ immune population using a GLM with age and sex as covariates in different APOE genotypes across the AD continuum. b Stacked bar graphs showing the percentage of T cell and CD4+ T cells subpopulations out of the total T cell and CD4+ T cell populations. c Volcano plots displaying differentially expressed genes (Punadjusted < 0.05) between different APOE genotypes in AD. Red and blue indicate respectively higher and lower expression. d Violin plots displaying the expression of the two genes that were differentially expressed in both APOE ε4ε4 and APOE ε3ε4 compared to the APOE ε3ε3 carriers. e Correlation matrix showing the association between immune cell populations with CSF biomarkers of AD neuropathology or cognition. A partial two-tailed Spearman correlation was performed and controlled for age and sex. f, g Correlation graph showing correlations of CD27+ B cells with CSF Aβ42 (f) and MMSE (g). a, d Violin plots showing median ± quartiles. f, g Graph shows linear regression ± 95% confidence intervals. n = 12 ε3ε3 AD, n = 12 ε3ε4 AD, n = 12 ε4ε4 AD. GLM = multivariate general linear model; AD = Alzheimer’s disease

