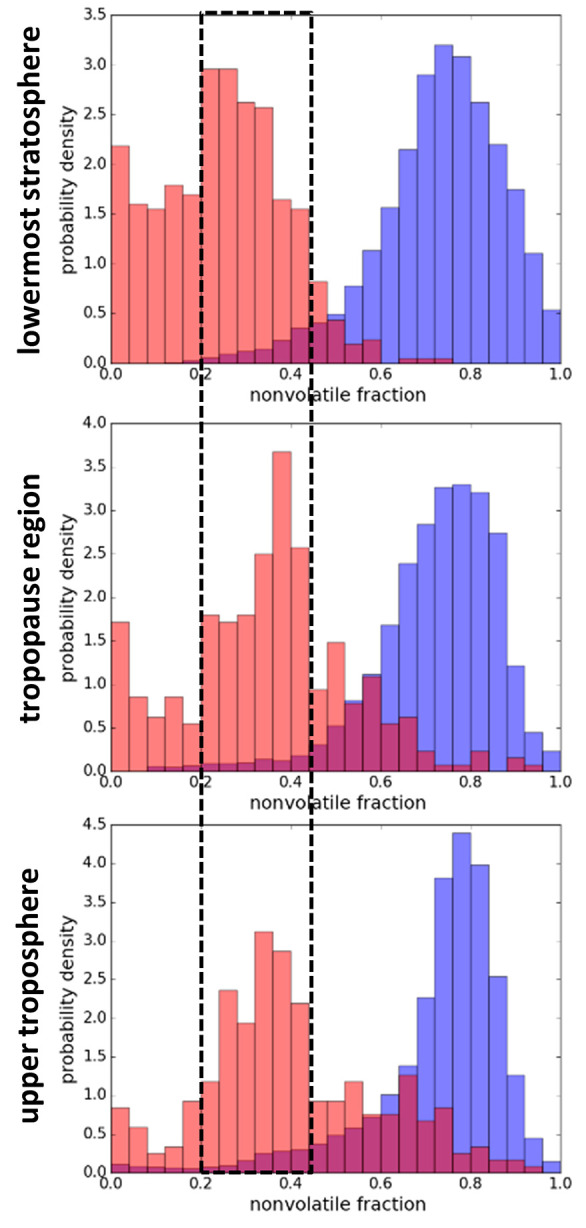
Figure 2.

Nonvolatile fraction distributions (D > 15 nm) for the plume excess aerosol (red) and the background aerosol (blue) separated for the upper troposphere, tropopause region, and lowermost stratosphere. The black dashed box indicates the range of the main mode of the plume excess nonvolatile fraction.
