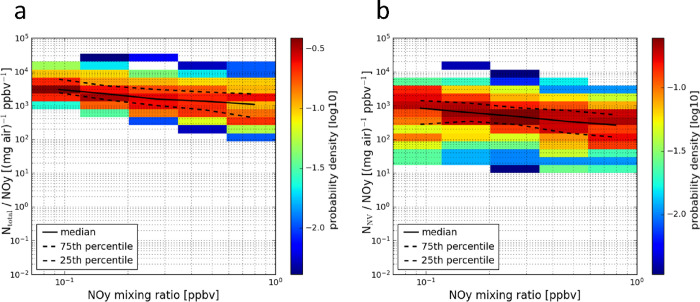
Figure 4.
Heatmaps of the plume individual total (a) and nonvolatile (b) particle number mixing ratios normalized by their corresponding NOy mixing ratios as a function of the NOy mixing ratios. The median and the 25th and 75th percentiles for each NOy bin are indicated by a black line and dotted black lines, respectively. The probability density within each NOy mixing ratio bin is color-coded.

