
Figure 4. Morphology and protein markers on EVs (MDA-MB-231 cell-derived) stored in PBS or a 5% sucrose solution (Suc) at −80 °C.
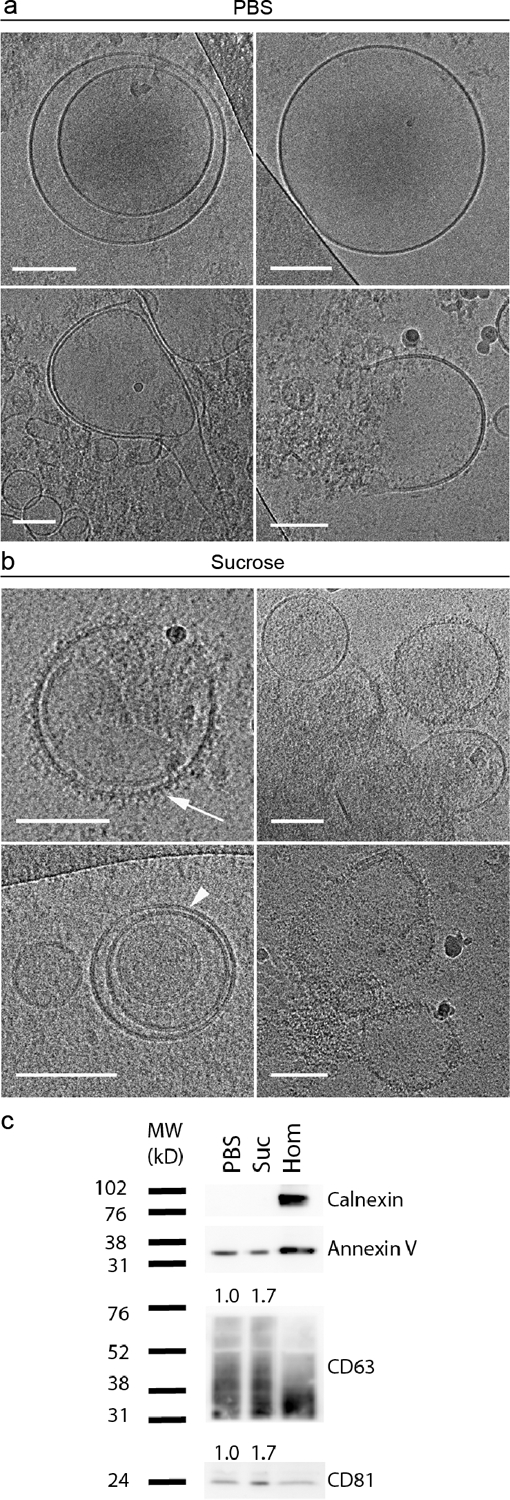
a,b) Cryogenic transmission electron microscopy (cryo-TEM) images. Scale bars correspond to 100 nm. Arrowhead: lipid bilayer resolved into its two leaflets; arrow: surface protrusions. c) Western blot analysis of calnexin (intracellular contaminant marker), cluster of differentiation (CD) markers CD63 and CD81 (transmembrane EV markers), and annexin V (cytosolic EV marker). Hom, cell homogenate control. Levels of transmembrane proteins CD63 and CD81 were calculated based on relative expression to the cytosolic protein, annexin V, and normalized to the PBS group; quantified values are reported above the protein bands.