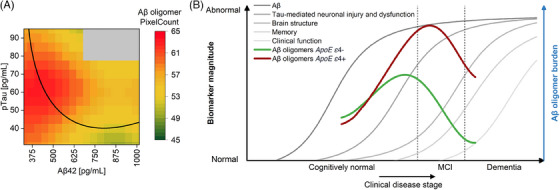
FIGURE 4.

Hypothetical model of amyloid beta (Aβ) oligomers in cerebrospinal fluid (CSF) within the Alzheimer's disease (AD) continuum. (A) Along the trajectory of biomarkers during AD progression from high Aβ42 and low pTau (A−T−) to lowered Aβ42 first (A+T−) followed by elevated pTau (A+T+), Aβ oligomers start to rise until a turning point is reached. Soon after pTau starts to increase, Aβ oligomer concentrations decrease. This panel is a zoomed‐in portion of Figure 3B. Data are represented in a binned form. (B) Hypothetical changes of Aβ oligomers during disease progression are transferred to the model of AD biomarker changes according to Jack et al. 1 Apolipoprotein E (APOE) gene ε4 allele carriers show higher oligomer concentrations with a peak at a more advanced disease stage but still in the early stages of the disease. Due to the high age of the cohort (60+) and the absence of persons with advanced AD, it was not possible to cover the entire x‐axis with the curves. For validation of the model, Figure S5 shows a comparison between the measured oligomer level and the oligomer level determined by regression. Figure modified after Jack et al. 33
