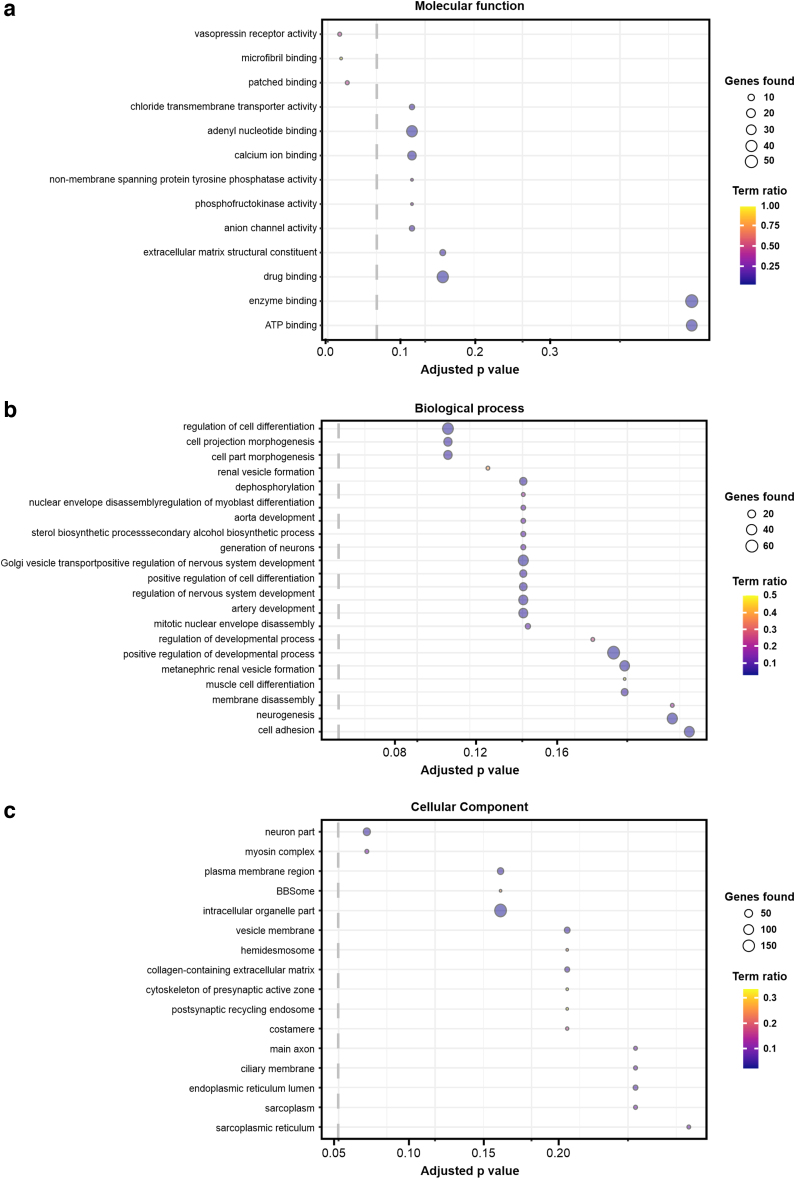
FIG. 2.
Overrepresented GO terms from filtered variants. The top GO terms are shown across the categories of (a) molecular function, (b) biological process, and (c) cellular component. The analysis was conducted using ConsensusPathDB from the total set of candidate variants. Term “ratio” is defined as the number of genes identified as belonging to a particular GO term divided by the total number of genes in that GO term. Adjusted p-values are obtained via a hypergeometric test and corrected for multiple hypothesis testing using the false discovery rate method. Dotted line shows the statistical significance threshold of Adjusted p-value = 0.05. GO, Gene Ontology.

