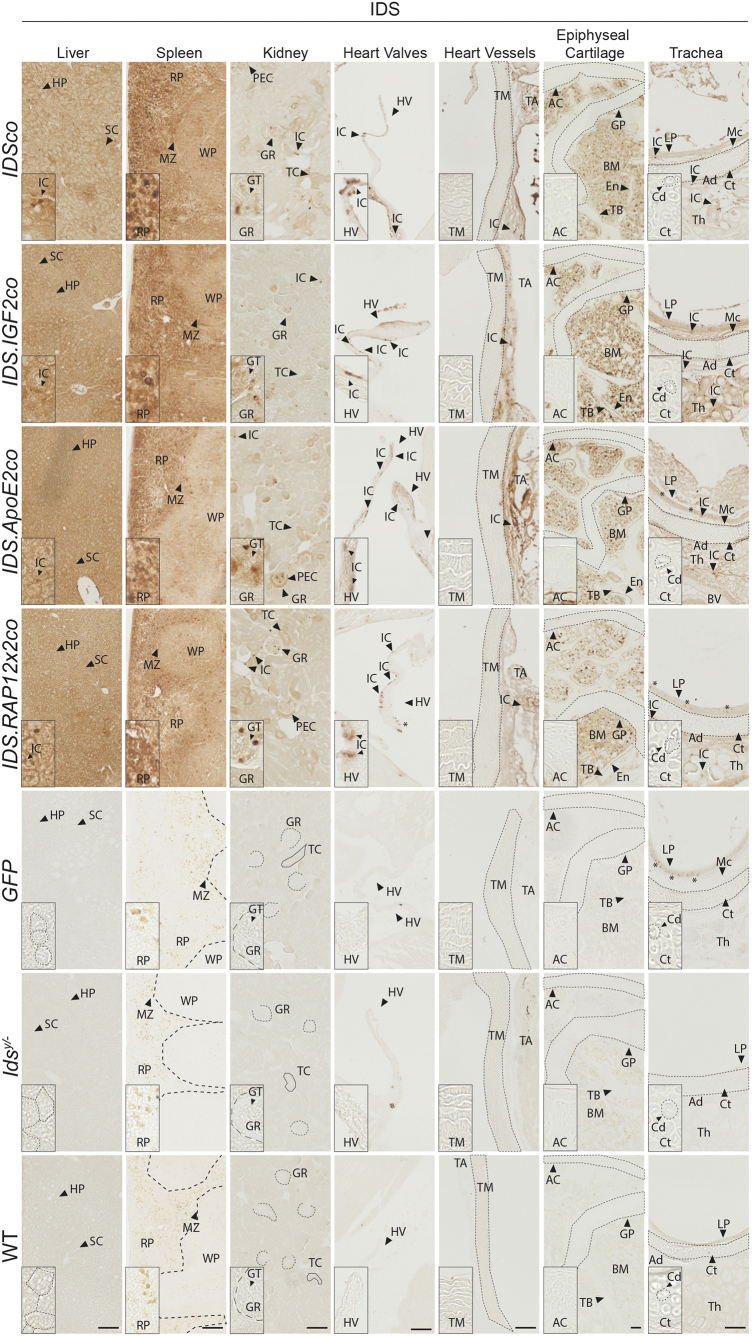
Figure 1.
Biodistribution of IDS protein after gene therapy. Two-month-old Idsy/− mice were treated with gene therapy using 9 Gray (Gy) total body irradiation and multiplicity of infection of 1 (Table 1). Representative pictures of IDS staining of liver, spleen, kidney, epiphyseal cartilage, trachea, heart valves, and great heart vessels of gene therapy-treated Idsy/− mice and controls. In kidney, dashed lines indicate the Bowman's capsule of the glomerulus, while solid lines indicate tubules. Dashed lines in liver represent hepatocytes. Enlarged pictures for the articular cartilage of the knee and for trachea are shown in Supplementary Fig. S1 (knee joint) and Supplementary Fig. S2 (trachea). Inserts represent regions of interest magnified four times. *Indicate artefacts. n = 3 biological replicas. Scale bar = 100 μm. AC, articular cartilage; Ad, tracheal adventitia; BM, bone marrow; Cd, chondrocytes; Ct, hyaline cartilage of the trachea; En, endosteum; GP, growth plate; GR, glomerulus; GT, glomerular tuft; HP, hepatocytes; HV, heart valve; IC, interstitial cells; IDS, iduronate 2-sulfatase; LP, lamina propria of the tracheal mucosa; Mc, tracheal mucosa; MZ, marginal zone; PEC, parietal epithelial cells of the Bowman's capsule; RP, spleen red pulp; SC, sinusoids; TA, tunica adventitia; TB, trabecular bone; TC, tubules; Th, thyroid gland; TM, tunica media; WP, spleen white pulp; WT, wild type.

