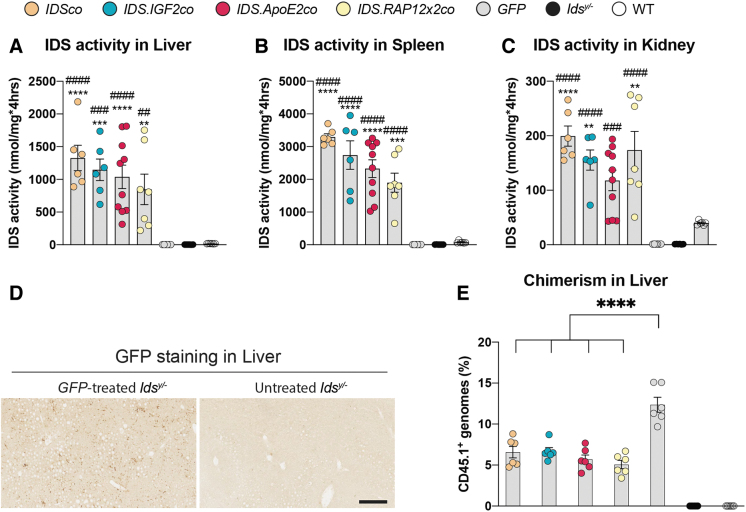
Figure 2.
IDS activity in liver, spleen, and kidney after gene therapy. IDS enzyme activity in liver (A), spleen (B), and kidney (C). (D) Sections of liver of GFP-treated and untreated Idsy/− mice stained with anti-GFP antibody. (E) Chimerism analysis of liver measured by allele-specific qPCR on the Cd45.1 locus. Data represent means ± SEM and were analyzed by one-way ANOVA followed by Bonferroni's multiple testing correction. Enzyme activity: IDSco, IDS.IGF2co, GFP, Idsy/−, and WT n = 6; IDS.ApoE2co n = 10; IDS.RAP12x2co n = 7. Chimerism: n = 6. GFP staining: n = 3. **p ≤ 0.01, ***p ≤ 0.001, ****p ≤ 0.0001. ##p ≤ 0.01, ###p ≤ 0.001, ####p ≤ 0.0001. Asterisks represent significance versus WT; hash represent significance versus Idsy/−. Significant results are indicated by brackets. ANOVA, analysis of variance; GFP, green fluorescent protein; qPCR, quantitative polymerase chain reaction; SEM, standard error of the mean.

