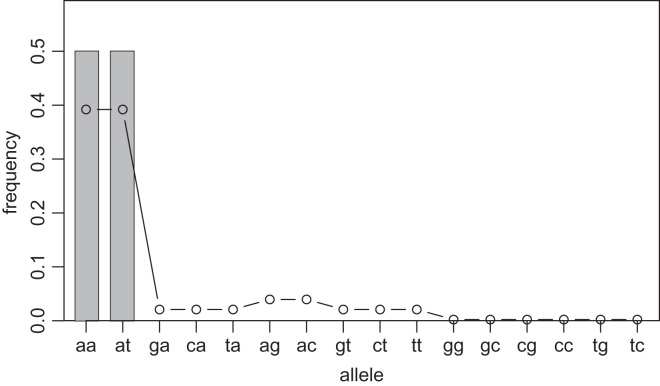
Figure 1. Sample allele frequencies and allele frequencies estimated by KDE on sequence space using the least squares cross validation.
The original samples are three “aa” and three “at” sequences shown as gray bars, and the estimated frequencies are shown as a line graph. The alleles “ag” and “ac” have a little high frequency because they are one distance away from both of the detected alleles, “aa” and “at”. The alleles “gg” to “tc” have the lowest frequency because they are most distant from the detected alleles.

