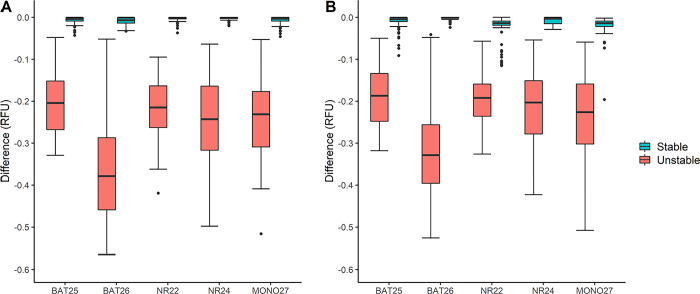
Fig 3. Boxplot over stable and unstable cases for the development cohort (n = 185).
The difference in RFU for the tumor sample compared to either universal or paired normal samples are plotted for each of the five microsatellite loci. Stable cases represented by light blue boxes and unstable cases by light red boxes as indicated by the figure legends. A) Difference using paired normal and tumor samples. B) Difference using tumor samples and a universal reference. RFU: relative fluorescence unit.

