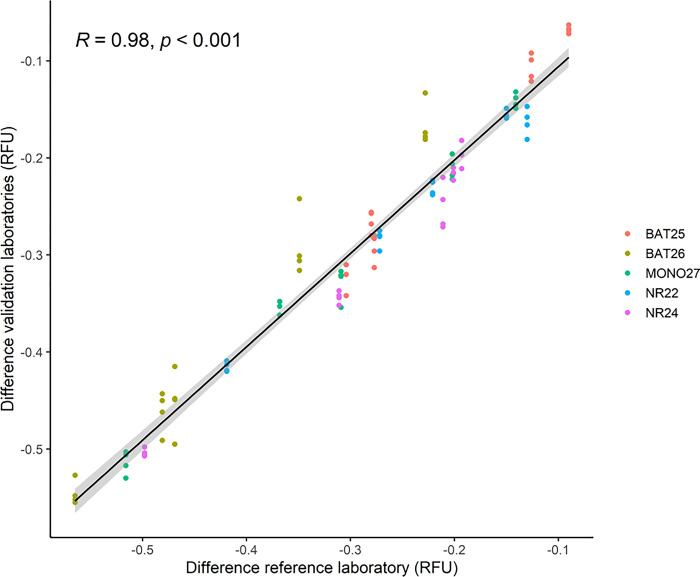
Fig 5. Correlation plot of unstable cases (n = 5) using paired samples.
The x-coordinates for the points are the difference of RFU obtained in the reference laboratory (laboratory 1) and the y-coordinate is the difference in RFU obtained in the validation laboratories (laboratory 2–5). A linear fit is applied to the points and the Pearson correlation coefficient (R), and p-values are shown. RFU: relative fluorescence unit.

