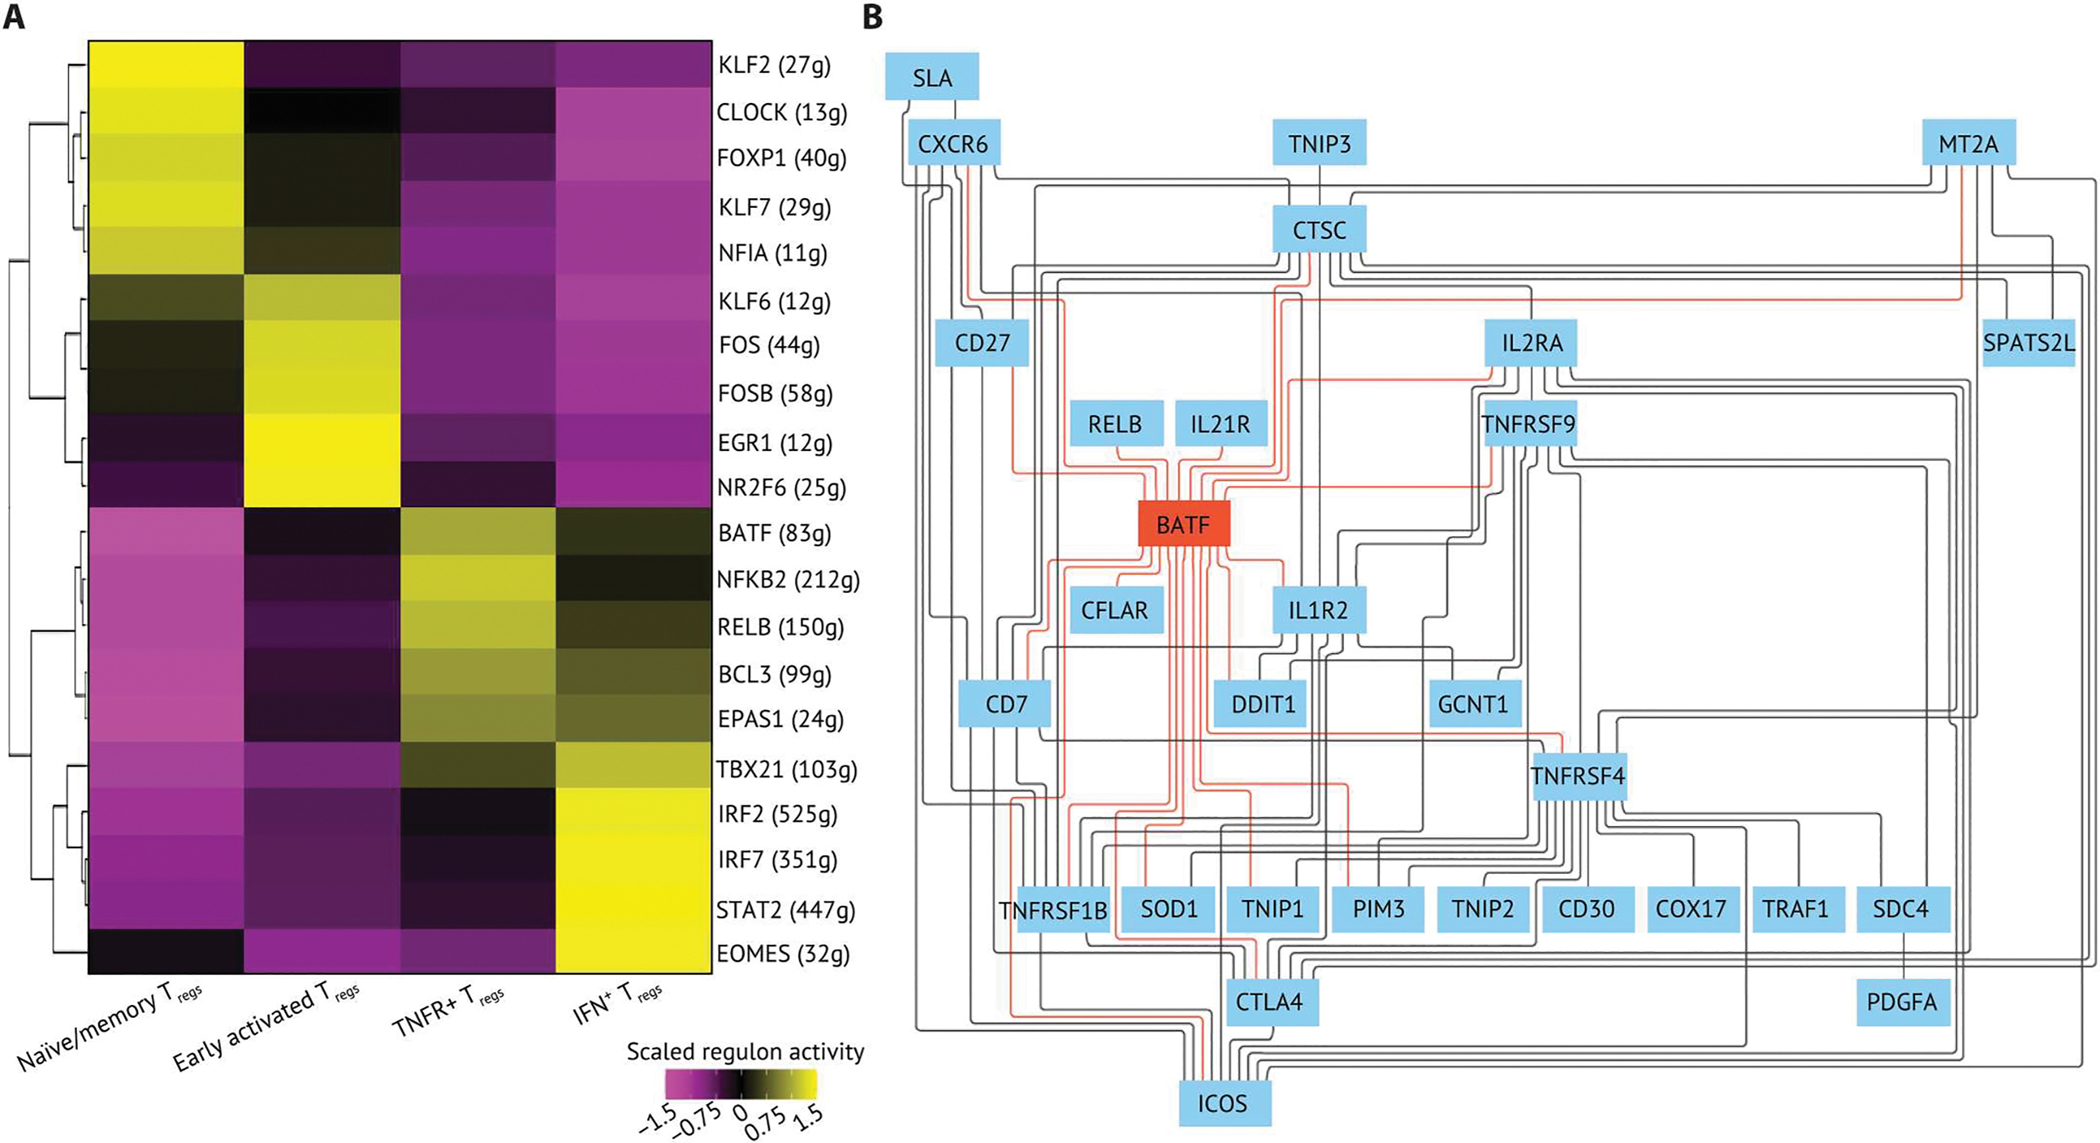
Fig. 3. An integrated BATF transcriptional network regulates key phenotypes of TNFR+ Tregs.

(A) The top five regulons differentially expressed in each Treg state were ranked by log2 fold change and visualized on a heatmap. The regulons were generated by using SCENIC with all Tregs (n = 9736) in the dataset. The regulon score was calculated by using AUCell in R, and the regulon score of each Treg subpopulation is scaled by row. The top five regulons were determined by their log2 fold change. (B) The GRN of TNFR+ Tregs. The GRN was constructed using directed MGM and FCI-MAX modeling with TFs and downstream targets from the top five regulons in TNFR+ Tregs. The direct connections between BATF and target genes are colored in red.
