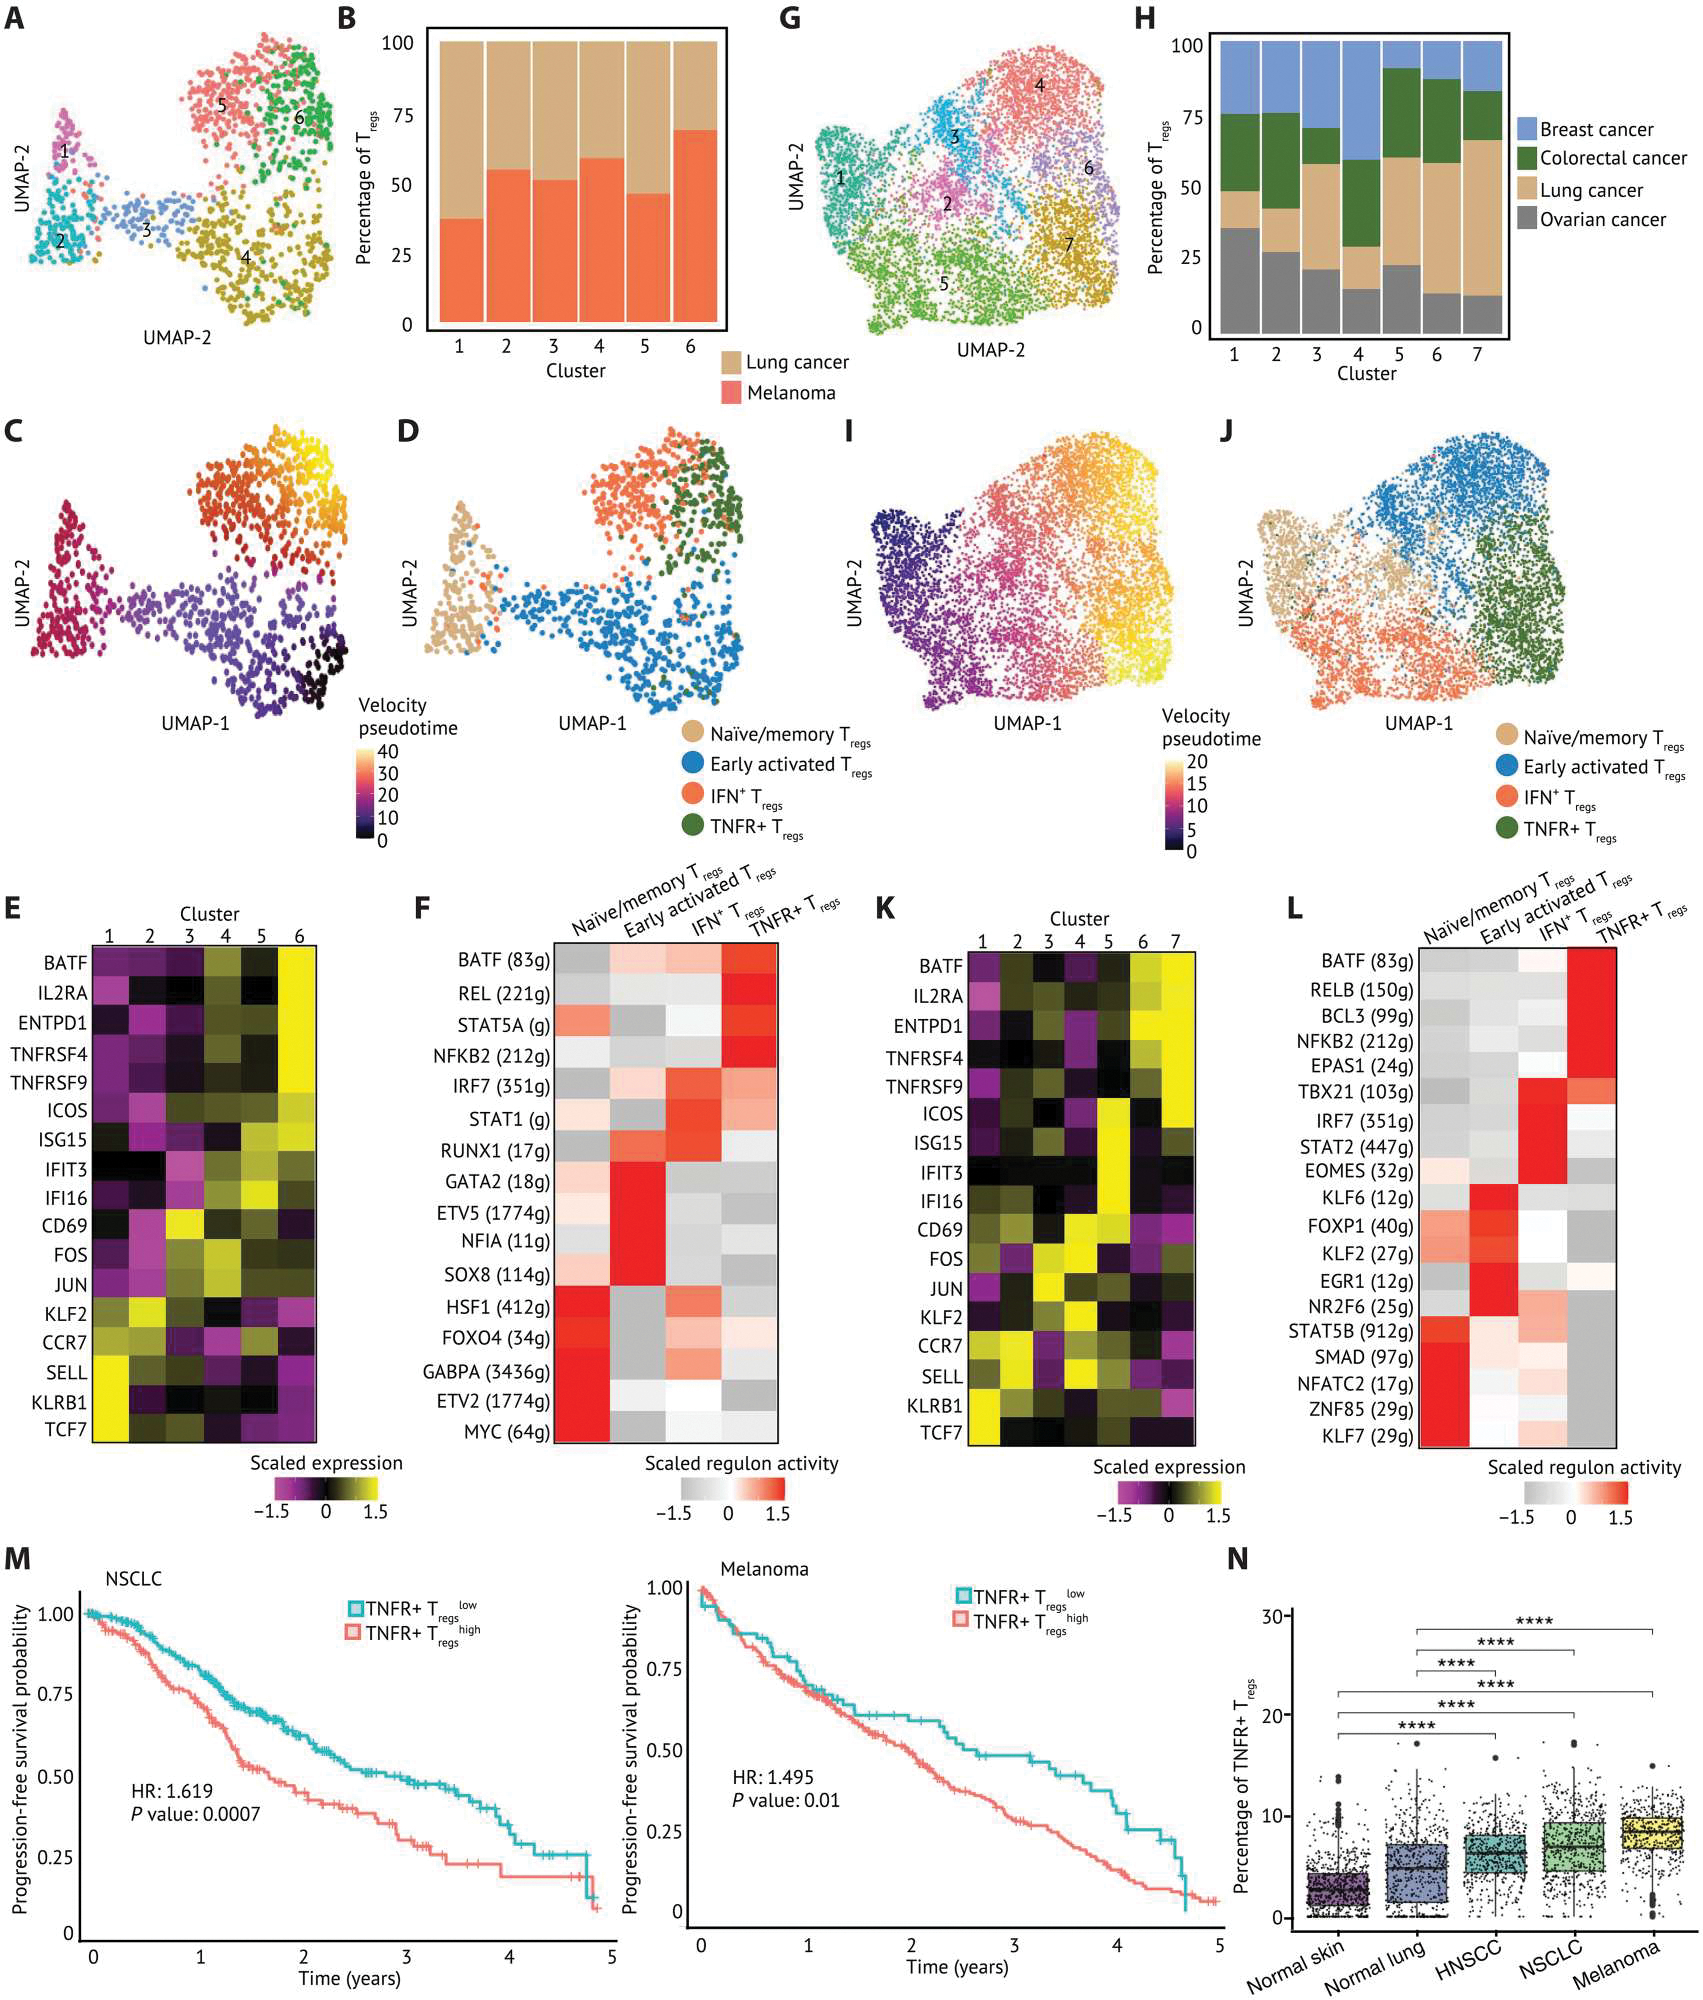
Fig. 4. TNFRSF-activated Tregs are highly enriched in solid TME compared with nontumor tissues and associated with worse prognosis across solid tumors.

(A) A UMAP embedding of 1294 Tregs in TILs and PBMCs from patients with melanoma (n = 4), NSCLC (n = 4), and SCLC (n = 1). Six clusters were identified by Louvian graph–based unbiased clustering. (B) A stacked barplot of percentage of Tregs in each cluster showed that Tregs from lung cancer and melanoma were distributed across six clusters. (C) Pseudotime derived from RNA velocity was visualized in a UMAP embedding, suggesting that Tregs in cluster 6 were at later pseudotime and more terminally differentiated. (D) Tregs were annotated by cell state and visualized in a UMAP embedding based on the cell state–related canonical marker genes, gene sets, and pseudotime inference. (E) The relative expression of selected canonical marker genes is visualized on a heatmap. (F) The top five regulons differentially expressed in each Treg cluster ranked by log2 fold change were visualized on a heatmap. (G) A UMAP embedding of 7045 Tregs in TIL from patients with ovarian cancer (n = 5), lung cancer (n = 8), breast cancer (n = 14), and colorectal cancer (n = 7). Seven clusters were identified by unbiased clustering. (H) A stacked barplot of percentage of Tregs in each cluster highlights the distribution of Tregs from each tumor type. Clusters 6 and 7 were mixed with Tregs across tumor types. (I) Pseudotime inferred by Slingshot was visualized in a UMAP embedding. (J) Tregs were annotated by cell state and visualized in a UMAP embedding. (K) The relative expression of selected canonical marker genes is visualized on a heatmap. (L) The top five regulons differentially expressed in each Treg cluster ranked by log2 fold change were visualized on a heatmap. The gene expression and enrichment score are scaled by transforming the expression or enrichment score in each population to zero mean, and unit SD is shown in the heatmap. (M) Associations of the enrichment of each Treg subpopulation with survival outcomes of patients with NSCLC and melanoma were calculated and visualized on Kaplan-Meier curves. Hazard ratio is calculated by monovariate Cox proportional hazard regression, and the P value is calculated by likelihood ratio test. (N) The enrichment of TNFR+ Tregs visualized in box plots was inferred using Cibersortx on datasets from the TCGA and GTEx. The inferred proportion of TNFR+ Tregs among all cells within each tissue score is shown. A pairwise comparison between each tissue source is calculated by a nonparametric Wilcoxon signed rank test. P values: ****P ≤ 0.0001.
