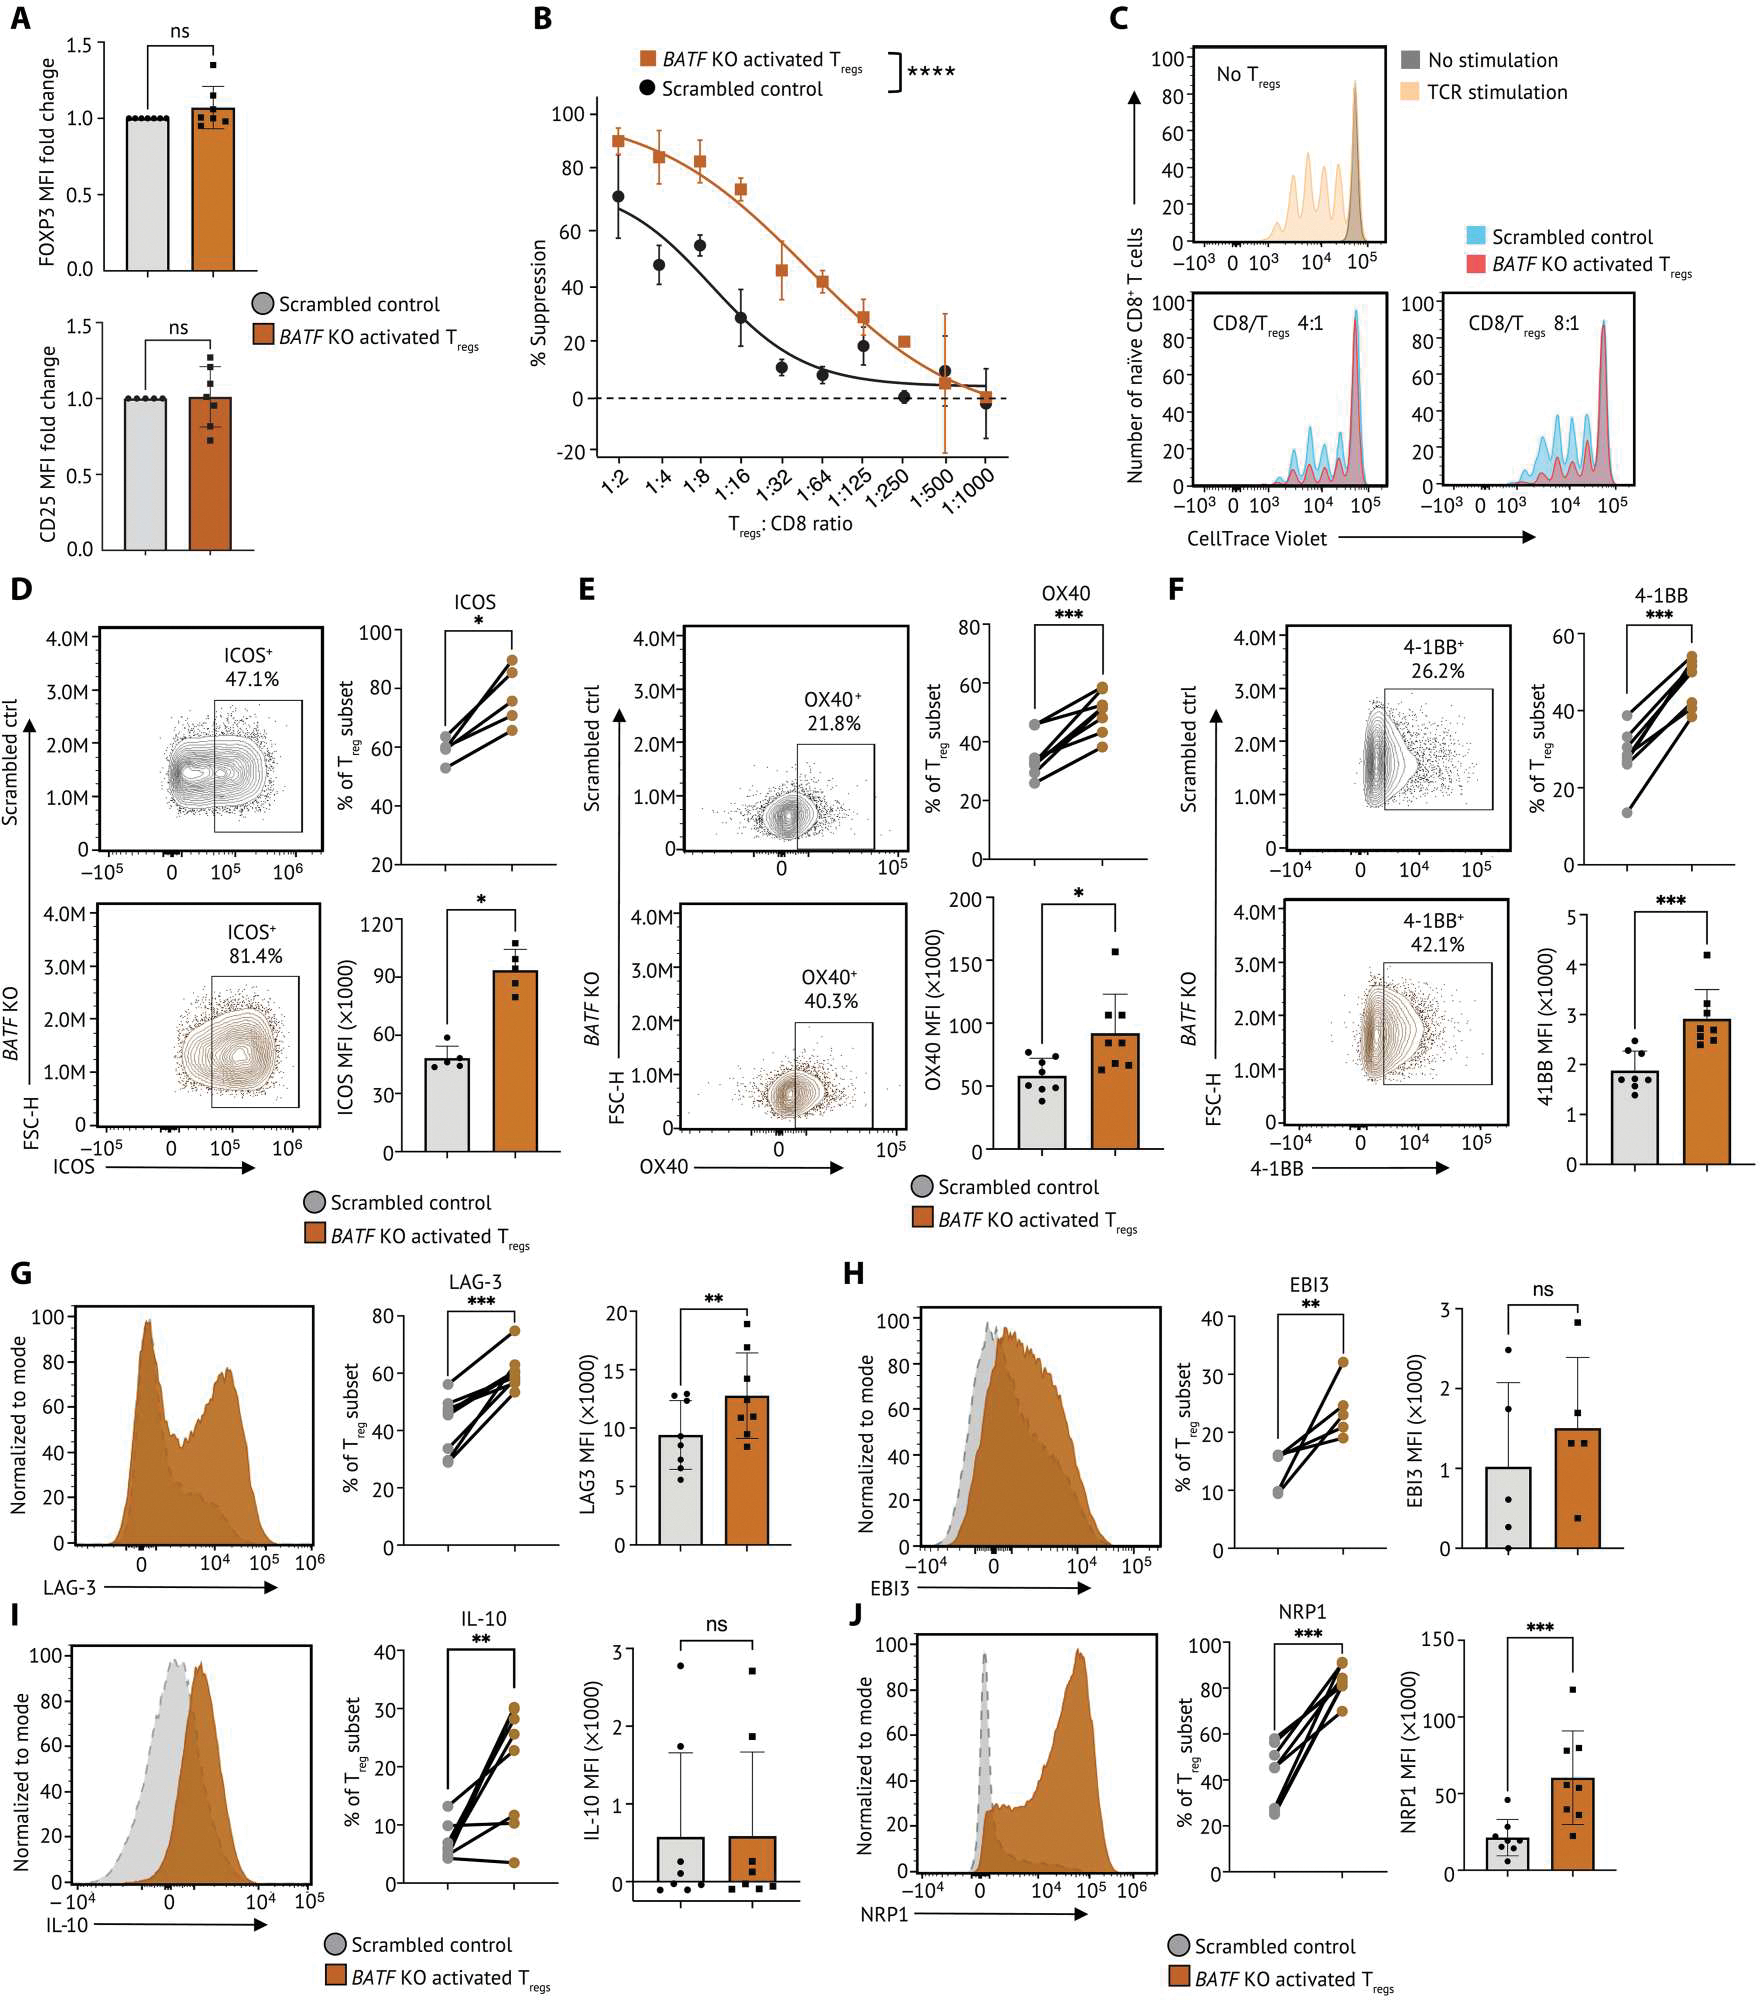
Fig. 6. BATF modulates the suppressive function of human activated Tregs.

(A) Tabulation of FOXP3 (top) and CD25 expression (bottom) in BATF KO activated Tregs (n = 7) and scrambled control from the same donor. Data were reported as fold change normalized to marker MFI of nontargeting scrambled control groups. Each dot indicates an individual replicate. Bars indicate the median of expression, and error bars represent 1 SD. (B) In vitro microsuppression assay comparing BATF KO activated Tregs (n = 6) and scrambled control from the same donor are shown. (C) Representative CD8+ T cell proliferation in Fig. 6B at different conditions: no TCR stimulation (gray); 5-day TCR stimulation without coculture with Tregs (yellow); 5-day TCR stimulation with CD8:Treg ratios as 4:1 and 8:1. Cell number at each condition was normalized to the highest cell number in the plot. (D) The expression of ICOS on BATF KO activated Tregs and scrambled control were determined by flow cytometry. The percentage of Tregs expressing ICOS was summarized on a dot plot, and the MFI of ICOS on Tregs was summarized on a bar plot. Data were pooled from five individual replicates. (E) The expression of OX40 on BATF KO activated Tregs and scrambled control were visualized by represented flow cytometry plots from eight individual replicates. The percentage of Tregs expressing OX40 was summarized on a dot plot, and the MFI of OX40 on Tregs (n = 8) was summarized on a bar plot. (F) The expression of 4–1BB on BATF KO Tregs and scrambled control were visualized by represented flow cytometry plots from seven individual replicates. The percentage of Tregs expressing 4–1BB was summarized on a dot plot, and the MFI of 4–1BB in Tregs was summarized on a bar plot. (G to J) The expression of (G) LAG-3, (H) EBI3, (I) IL-10, and (J) NRP1 on BATF KO activated Tregs and scrambled control were visualized by represented flow cytometry plots from five individual replicates. The percentage of Tregs expressing marker genes and the MFI were summarized on a dot plot and a bar plot, respectively. Samples from the same donor were connected by solid lines. Each dot indicates an individual replicate. Bars indicate the median of expression, and error bars represent 1 SD. Data were pooled from five to eight individual replicates. Markers that have fewer replicates than others were subsequently incorporated into the flow panel as the study progressed. Data in (A) and (D) to (J) were analyzed by a ratio paired t test, and data in (B) were analyzed by two-way ANOVA test. P values: ns: P > 0.05; *P ≤ 0.05; **P ≤ 0.01; ***P ≤ 0.001, ****P ≤ 0.0001.
