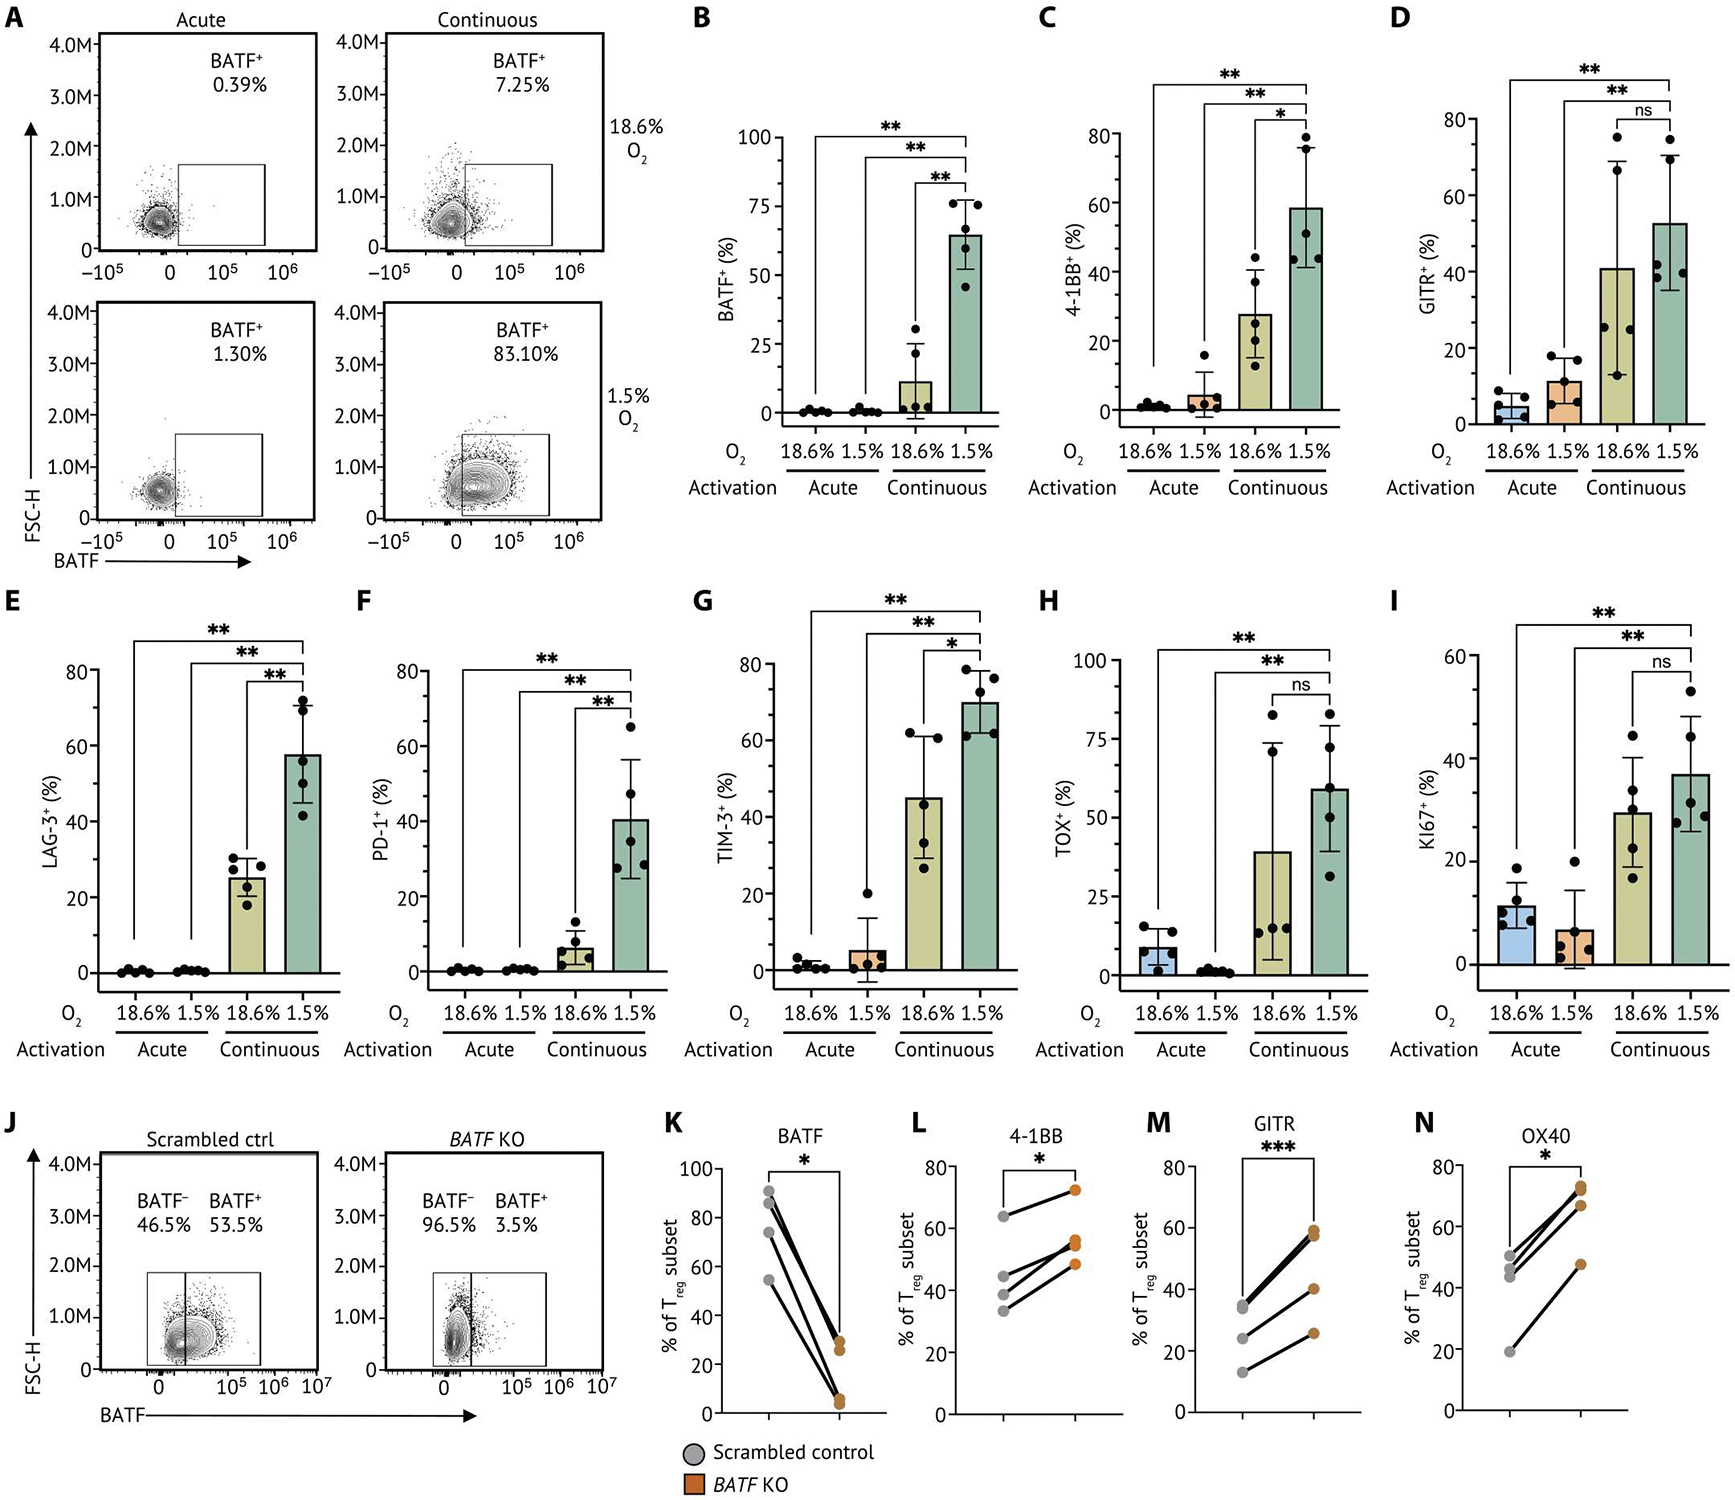
Fig. 7. Human Tregs cultured with continuous TCR stimulation under hypoxia mimic intratumoral BATF-driven TNFR+ Treg phenotypes.

(A) Human primary Tregs isolated from cord blood were cultured in acute TCR stimulation (acute) in normoxia (20% O2), continuous TCR stimulation (continuous) in normoxia, acute stimulation in hypoxia (1.5% O2), and continuous stimulation in hypoxia. Representative flow cytometry plots of five individual replicates showing BATF protein level in Tregs with continuous TCR stimulation under normoxia and hypoxia. (B) A bar plot summarizing the percentage of Tregs expressing BATF identified in Tregs in each culture condition. The percentage of Tregs expressing 4–1BB (C), GITR (D), LAG-3 (E), PD-1 (F), TIM-3 (G), TOX (H), and KI67 (I) identified in TNFR+ Tregs (n = 5) was summarized on a bar plot. Each dot indicates an individual replicate. Bars indicate the median of expression, and error bars represent 1 SD. (J) BATF deletion was conducted by CRISPR RNP KO in human Tregs with continuous TCR stimulation under hypoxia at day 10. Representative flow cytometry plots of four individual replicates showing the proportion of Tregs expressing BATF after 48-hour repeated TCR stimulation. (K) Tabulation of the percentage of Tregs expressing BATF from four individual replicates. (L to N) The percentage of Tregs expressing 4–1BB, GITR, and OX40 was summarized on a dot plot. Samples from the same donor were connected by solid lines, and each dot indicates an individual replicate. Data were pooled from four individual replicates. Data in (B) to (I) were analyzed by a nonparametric Mann-Whitney U test, and data in (K) to (N) were analyzed by a ratio paired t test. P values: ns: P > 0.05; *P < 0.05; **P < 0.01; ***P < 0.001.
