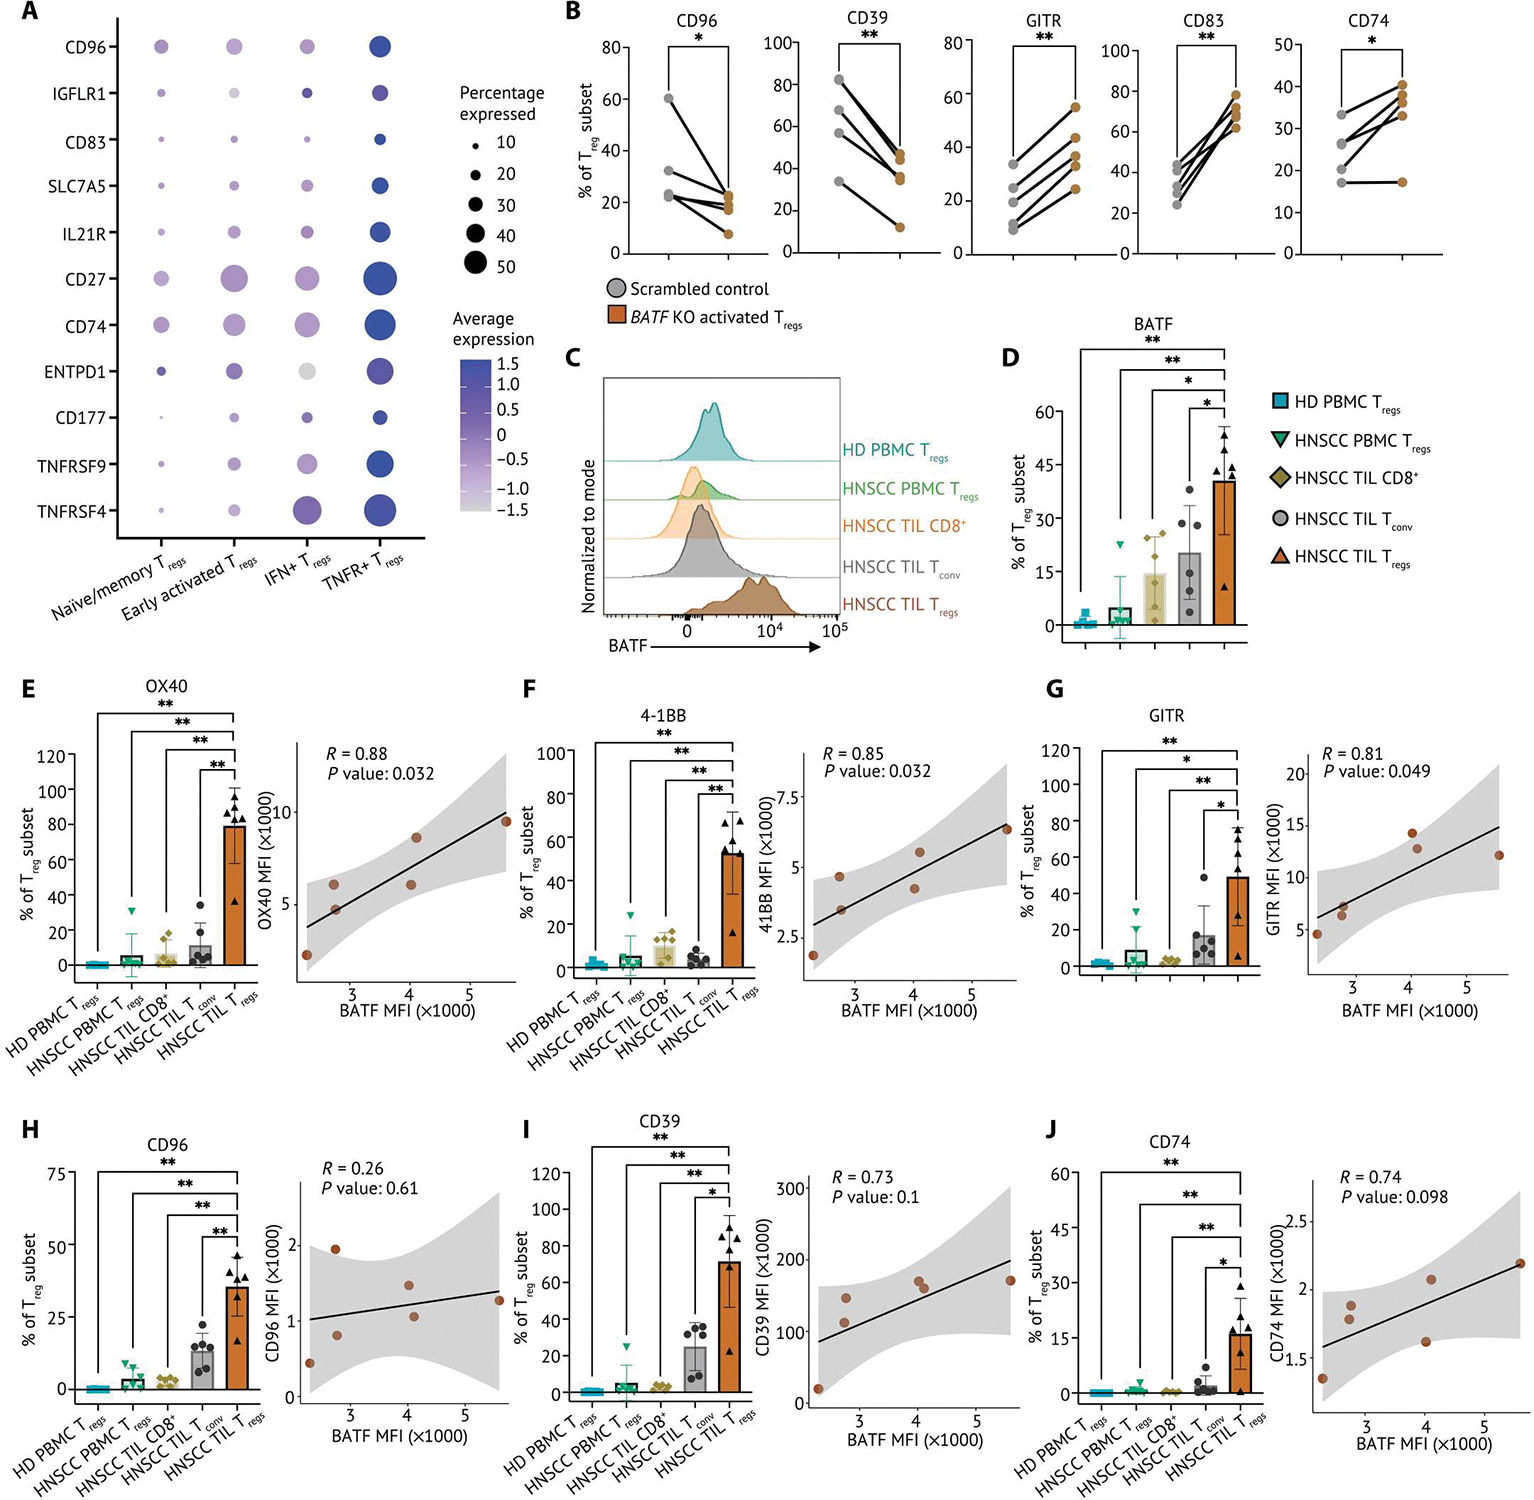
Fig. 8. TNFR+ Tregs express BATF-regulated surface markers preferentially in the HNSCC TME.

(A) Relative expression of surface markers differentially expressed on TNFR+ Tregs and percentage of Treg subset in the single-cell HNSCC dataset were visualized on a dot plot. (B) Frequency of CD96, CD39, GITR, CD83, and CD74 expression determined by flow cytometry from control and BATF-null human activated Tregs from cord blood (n = 5). Samples from the same donor were connected by solid lines, and each dot indicates an individual replicate. (C) Matched TILs and PBMCs from patients with HNSCC (n = 6) and HD PBMC (n = 5) were stained for flow cytometry phenotyping. Representative flow plot of BATF expression in TILs and PBMCs from patients with HNSCC and HD PBMCs, normalized to mode scales as a percentage of the maximum count. (D) Tabular summary of percentage of cells expressing BATF from patients with HNSCC (n = 6) and HD PBMCs (n = 5). (E to J) The percentage of Tregs expressing surface markers identified in TNFR+ Tregs from matched TILs and PBMCs from patients with HNSCC (n = 6) and HD PBMCs (n = 5) is summarized on a bar plot. Each dot indicates an individual replicate. Bars indicate the median of expression, and error bars represent 1 SD. The coexpression of BATF expression and marker genes by MFI in HNSCC TIL Tregs was shown in scatterplots. The Pearson correlation coefficient (R) between the expression BATF and marker genes was calculated by the MFI in HNSCC TIL Tregs. The significance of Pearson correlation coefficient (P) was calculated by t test. Data in (B) were analyzed by a ratio paired t test, and data in (D) to (J) were analyzed by a nonparametric Mann-Whitney U test. P values: *P ≤ 0.05; **P ≤ 0.01.
