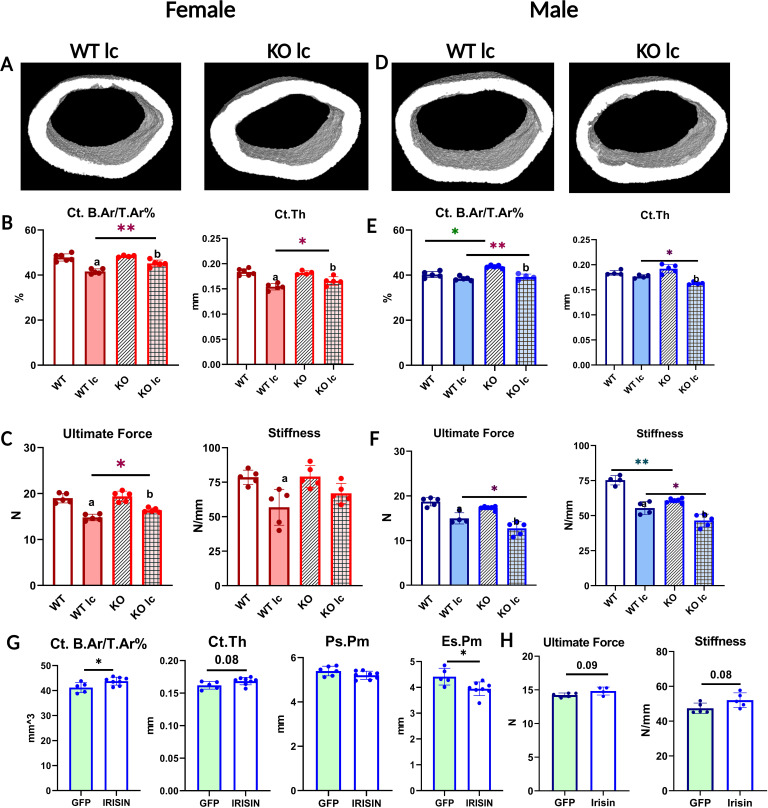
Figure 2. FNDC5 KO female and male mice have opposite responses to a low- calcium diet with regard to bone composition, structure, and mechanics, and irisin injection rescues FNDC5 KO male mice phenotype under a low-calcium diet.
(A) Representative micro-computed tomography (µCT) images of femoral midshaft cortical bones from WT low-calcium diet female mouse (WT lc) and KO low-calcium diet female mouse (KO lc). (B) Female femoral midshaft cortical bone parameters of WT control (WT), WT low-calcium diet (WT lc), KO control (KO), and KO low-calcium diet (KO lc) mice reported as cortical bone area fraction (Ct. B.Ar/T.Ar%) and cortical thickness (Ct.Th). (C) Mechanical properties of femurs from female WT and KO control and low-calcium diet reported as ultimate force and stiffness. (D) Representative µCT images of femoral midshaft cortical bones from WT low-calcium diet male mice (WT lc) and KO low-calcium diet male mice (KO lc). (E) Male femoral midshaft cortical bone parameters of WT control (WT), WT low-calcium diet (WT lc), KO control (KO), and KO low-calcium diet (KO lc) mice reported as cortical bone area fraction (Ct. B.Ar/T.Ar%) and cortical thickness (Ct. Th). (F) Mechanical properties of femurs from male WT and KO control and low-calcium diet reported as ultimate force and stiffness. n = 4–5/group. a=Significantly different from WT, b=significantly different from KO, *=p<0.05, **=p<0.01. Two-way analysis of variance (ANOVA) was performed. As depicted here, red is female, and blue is male. (G) µCT measurement of femoral cortical bone of AAV8-GFP or AAV8-irisin-injected male KO mice after a 2-week low-calcium diet, reported as cortical bone area fraction (Ct. B.Ar/T.Ar%), cortical thickness (Ct. Th), periosteal parameter (Ps.Pm), and endosteal parameter (Es.Pm). (H) Mechanical properties of femurs from male KO low-calcium diet mice injected with AAV8-GFP or AAV8-irisin reported as ultimate force and stiffness. n = 5–7/group, *=p<0.05. Student’s t-test was performed for statistical analysis between male KO GFP vs irisin-injected mice. As depicted here, green shaded bars represent GFP-injected mice.

