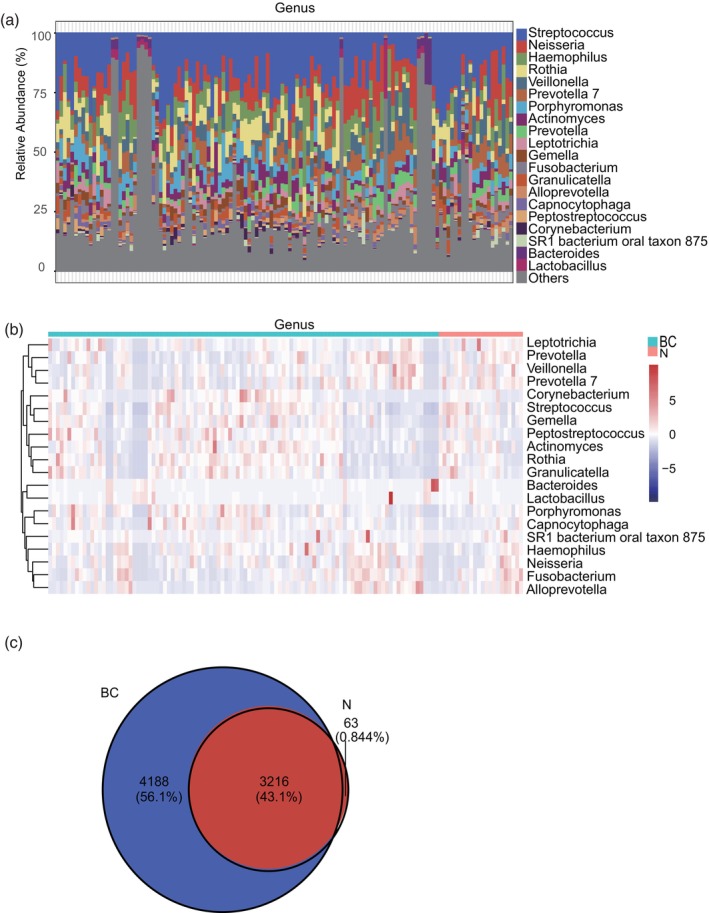
FIGURE 3.

Differences in the composition and distribution of the oral microbiome in patients with breast cancer (BC) and healthy controls (N). (a) Bar chart showing the relative abundance of the bacterial taxa at the genus level. (b) Heat map showing species abundance clustering at the genus level. (c) Venn diagrams showing the composition of the different gut microbiome groups at the species level.
