FIGURE 4.

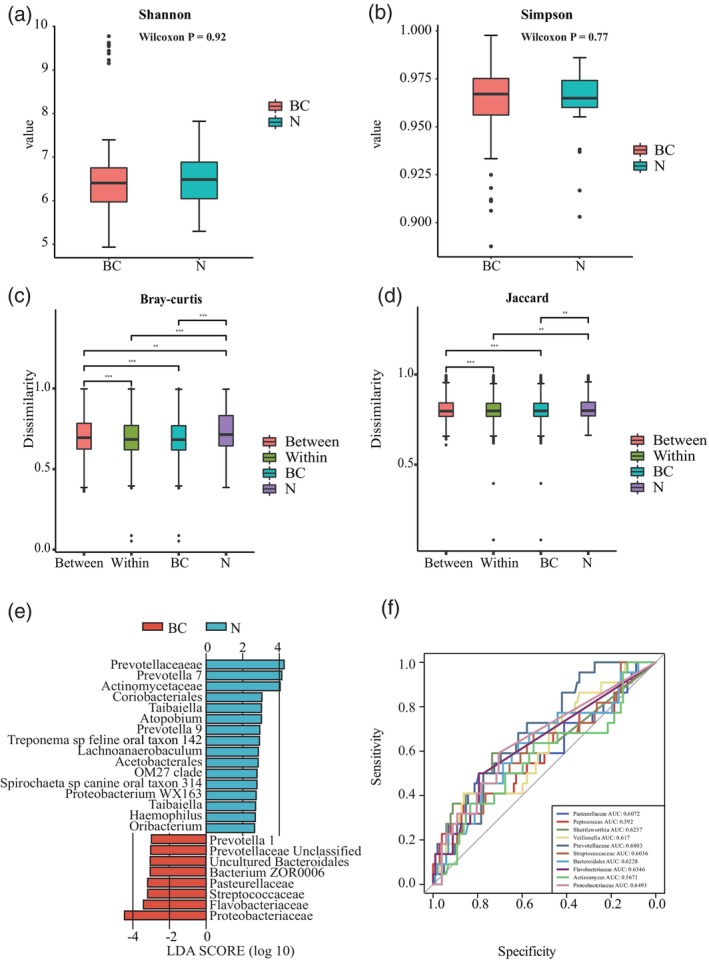
Relative abundances of the oral microbiome in patients with breast cancer (BC) and healthy controls (N). (a) Alpha diversities of the oral microbiota described using the Shannon index. (b) Alpha diversities described using the Simpson index. (c) Beta diversities of the oral microbiota based on Bray–Curtis distances. (d) Beta diversities based on Jaccard distance. (e) Linear discriminant analysis effect size analysis between the breast cancer (BC) and healthy control (N) groups. (f) Receiver operating characteristic (ROC) analysis of the top 10 genera in the BC and N groups.
